Silver has thousands of industrial uses and is considered a store of wealth by investors. The infographic below illustrates silver's history as a currency in the past and as an essential component in industry and technology today.
Read More »Rising Deflation Concerns Could Cause Gold to Plummet Dramatically – Here’s Why (2K Views)
The arguments for gold to rise dramatically are well known and highly publicized. The arguments for gold to remain flat or to decline are minimally discussed and generally attacked vigorously when raised. [I do just that in this article and the conclusions will not be liked by the goldbugs.] Words: 285
Read More »Latest Comments By Jim Rogers, John Paulson & Jeremy Grantham On Gold (+2K Views)
Gold is known as a solid inflation hedge, and could earn this reputation in 2013 if inflation picks up. Below are three well-known gold bugs (Jim Rogers, Jeremy Grantham and John Paulson) and their bold predictions for investing in gold next year and beyond. Words: 525
Read More »There's Nothing Certain in Life Except Death,Taxes & $2,300 Gold by Jan. 2014! Here's Why
While many of us don't like making price predictions, and certainly ones accompanied by a specific date, it's hard to ignore the correlation between the U.S. monetary base and the gold price. That correlation says we'll see $2,300 gold by January 2014 - and $2,500 by the end of 2014. [Let me explain.] Words: 567
Read More »Gold & HUI About to Turn Upwards, Reach All-time Highs By Year-end and Continue Dramatically Higher into 2014! Here's Why
...Gold is about to undergo a profit-taking event...as a result of the USD beginning a rally, probably beginning today. I'm looking for the dollar index to test the downward sloping 200 day moving average [see chart below] before rolling over and continuing the secular trend. This should drive gold down into a final intermediate degree bottom around $1694 or so before testing the all-time highs at or slightly above $1900 sometime before the end of the year. [Let me explain why that is most likely going to happen.] Words: 401
Read More »Gold: The Top 10 Holders & Producers by Country– and 23 Investment Options (+3K Views)
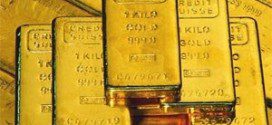
Gold is one of the rarest metals in the world, and has a long history as a valuable and intensely sought-after element. The precious metal has served as the basis for physical currency for thousands of years, and many monetary systems throughout human history have utilized a gold standard that focused on the precious metal. Exploration and production of gold has become a major industry in regions that maintain significant deposits of the metal, and quests for gold have been the impetus of countless expeditions and discoveries. [Below are a list of the top 10 gold producing countries, the top 10 gold producing companies and a definitive guide as to the multiple options of investing in the metal.]
Read More »The Top 10 Silver Producing Countries & Companies – and Investment Options (+7K Views)
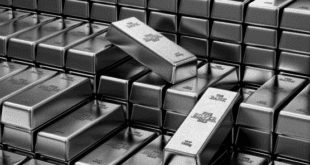
Silver has been an important metal for thousands of years, often used as a medium of exchange or jewelry in ancient times....Today, silver still finds its way into jewelry and coins but it is now also a key ingredient in many ‘modern’ applications as well....Due to this multitude of uses the metal has continued to be a popular investable asset...[as well] as a store of value and an inflation hedge. Below are a list of the top 10 silver producing countries, the top 10 silver producing companies and a definitive guide as to the multiple options of investing in the metal. Words: 2091
Read More »GOLD: The Currency Without a Printing Press
When it comes to investing in gold, investors often see the world in black and white. Some people have a deep, almost religious conviction that gold is a useless, barbarous relic with no yield and an asset no rational investor would ever want. Others love it, seeing it as the only asset that can offer protection from the coming financial catastrophe, which is always just around the corner. Our views are more nuanced and, we believe, provide a balanced framework for assessing value. Our bottom line: given current valuations and central bank policies, we see gold as a compelling inflation hedge and store of value that is potentially superior to fiat currencies. [Here are the details of our analyses.] Words: 1316
Read More »Axel Merk: Six Reasons to Buy Gold Today
Price is determined by demand and supply and, going forward, demand for gold may continue to rise, while supply will remain constrained as it has since the beginning of time. With this backdrop, let’s explore some specific reasons investors may consider buying gold at today’s prices. Words: 1315
Read More »My Case Against the Case Against The Case Against Gold (+2K Views)
All thing considered, it seems clear that the long-term real returns of gold have been poor (compared to stocks and bonds), and I see no reason to expect long-term price appreciation for gold to be above inflation. In fact, as with any non-income producing asset, it would be unreasonable to expect gold to provide significant positive real returns over an indefinite period of time...I would argue that buying gold is a short-term gamble that is completely dependent on the unpredictable vagaries of perception, market psychology and the "greater fool" theory...While it is true that gold can be a good short-term trade and offer superior returns over shorter periods (as has been the case in recent years) I believe that stocks will continue to substantially outperform gold over time. [Let me explain these less than popular conclusions further.] Words: 1258
Read More »