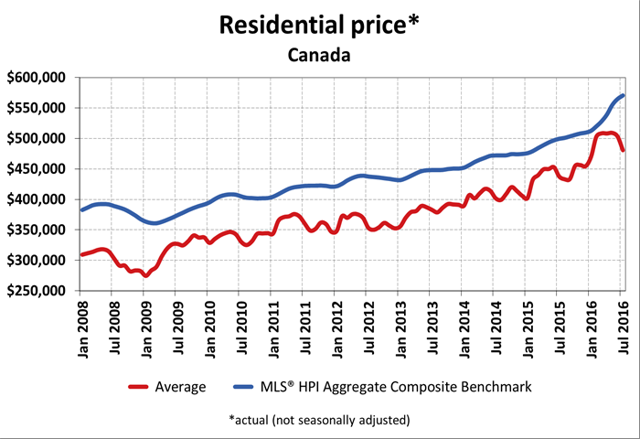
The price of an average (benchmark) home in Vancouver, Canada is $1,400,000…[which] is 30.1%  higher than it was a year ago. Yes, 30.1%! Everything seems rosy when riding a hot investment until one thing goes awry. We never seem to know what that’ll be, but experienced money managers usually get the heebeejeebies just before it happens -and that’s what is happening these days].
The comments above and below are excerpts from an article by Malvin Spooner (maverickinvestors.com) which has been edited ([ ]) and abridged (…) to provide a faster and easier read.
Two potential threats to housing in Canada are becoming evident:
1. The Canadian Real Estate Association…recently [stated that] “The number of homes trading hands via Canadian MLS® Systems fell by 1.3% month-over-month in July 2016 and, with similar monthly declines having been posted in May and June, national sales activity in July came in 3.9% below the record set in April 2016.”
This trend in particular is worrisome [because,] in my experience as a portfolio manager, one of the more serious indications of trouble pending for a security is when the price continues to rise but there are fewer and fewer trades. There are more scientific reasons, but my own explanation is there are fewer and fewer fools. The next leg is many trades – mostly selling.
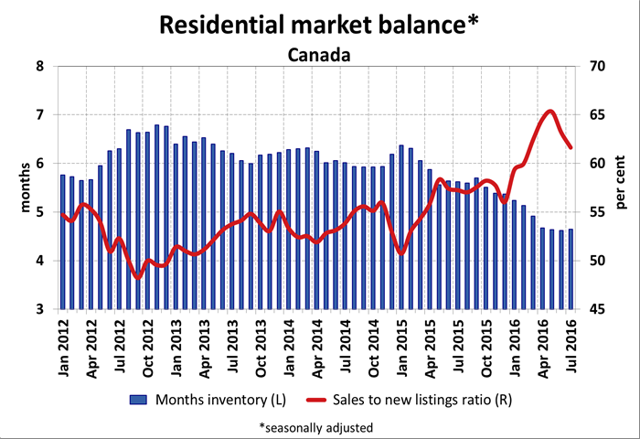
The inventory of homes for sale is declining or sales as a percent of new listings has been rising. Housing has an interesting dynamic differing from actual securities. As we see from the Vancouver situation (above), there comes a point at which potential sellers from the ‘home’ market are constrained from transacting (providing supply). Despite a ridiculously attractive price, it will be impossible to find a home to buy and move in to that isn’t also ridiculously priced.
2. The other pin that will inevitably puncture Canada’s inflated housing market…is a move by the Fed to test a bump in interest rates.
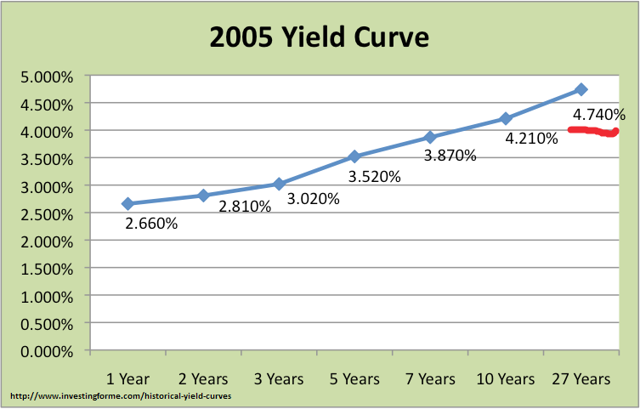
Below is the yield curve for Government of Canada bonds in 2005…
I am using 2005 for two reasons. One is that I consider it to be more or less a ‘normal’ time, keeping in mind that the concept of normality is very subjective. Back in the early 80s mortgage rates in Canada peaked at 21%. At that time, 15% interest rates were becoming pretty ‘normal’ in the minds of people. The other reason is that although it seems like ages ago, 2005 is fairly recent.
The ‘financial crisis’ isn’t so long ago that people have forgotten how bad things got, and the mess was ignited by a major meltdown in the U.S. housing market. What many (especially younger) folks don’t realize is that we go through mini-meltdowns in housing markets quite frequently. We humans have a tendency to rely too heavily on what just happened when trying to guess what will happen next. It gets us into lots of trouble…
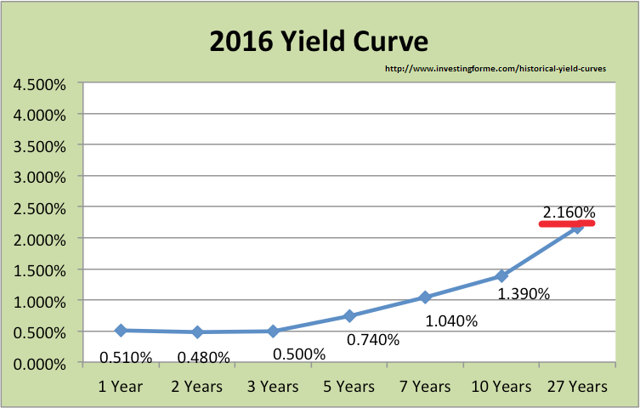
Now take a look at this year’s yield curve for Canada bonds.
The yield curve this year (not exactly up-to-date but captures the overall lower structure of rates) is still very much a product of the financial crisis. Pressure by governments and central banks to keep interest rates low, encourage borrowing and spending have not abated in years.
It is natural, but dangerous to assume that in future years or even months, interest rates will remain at levels not too far from where they have been in recent years. Why is this important? Because mortgage rates are typically a few percentage points higher than government bond rates as we know.
Just for fun, what if you have a 27-year mortgage (the time period is purely arbitrary, just so I can show the impact of a change in rates) with an interest rate of 2.5%? (Long-term government bond yields are actually lower right now than indicated in the chart) and, what if suddenly things change and you’re forced to negotiate a new normal rate of 5.0%? (Please countenance my keeping it simple – annual compounding rather than semi-annual and very lax rounding, among other things.}
The average price of a house in Canada is around $500,000. Say 80% of this is financed by a mortgage or $400,000. At 2.5%, the annual payments are (very roughly) something like $20,500 (or very roughly $1700 a month). Bump the mortgage rate to 5.0% – which doesn’t ‘sound’ so much higher – and the annual payment grows to well over $27,000 or somewhere around $2,275 monthly.
I can promise you, it’s unlikely your take-home pay will increase 30% to help soften the blow and, if that isn’t bad enough, suppose you can no longer make the higher payments and want to sell the property? You paid $500,000 for a house that you could now sell for only $400,000 (which is what you owe).
You might correctly argue that this sort of wholesale change in market rates is unlikely to happen overnight. Maybe not, but the result is the same. Home or investment property, you’ve pretty much lost 20% when you were hoping to make money. OUCH!
The hot housing market has not only been fueled by foreigners investing/trading in Canada, but also by Canadians using as much leverage as they can to participate as well. The amount of debt assumed by households has ballooned.
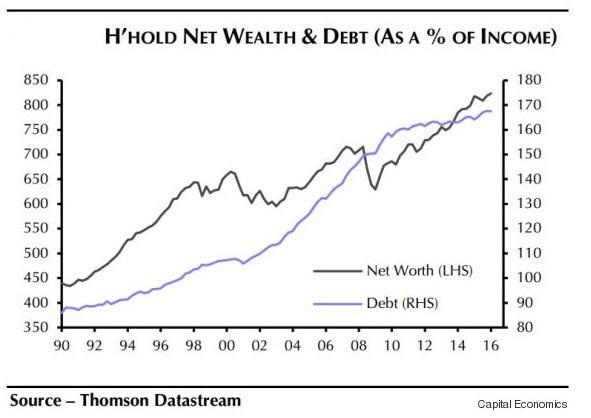
Rising home prices makes net worth look like it’s also skyrocketing, enabling regular homeowners and speculators to borrow more. No doubt foreign investors have taken advantage of low mortgage rates to help finance their purchases but there’s not enough data to determine to what extent.
Bottom line: When the Fed moves, so will the Bank of Canada and profitable ‘trades’ will suddenly become losses. Especially foreign investors (the fast money) will do what all traders do under these circumstances – sell rapidly, desperate to avoid even steeper losses…
Disclosure: The above article has been edited ([ ]) and abridged (…) by the editorial team at  munKNEE.com (Your Key to Making Money!)
  to provide a fast and easy read.
“Follow the munKNEE” on Facebook, on Twitter or via our FREE bi-weekly Market Intelligence Report newsletter (see sample here , sign up in top right hand corner)
Links to More Sites With Great Financial Commentary & Analyses:
ChartRamblings; WolfStreet; MishTalk; SgtReport; FinancialArticleSummariesToday; FollowTheMunKNEE; ZeroHedge; Alt-Market; BulletsBeansAndBullion; LawrieOnGold; PermaBearDoomster; ZenTrader; EconMatters; CreditWriteDowns;
 munKNEE.com Your Key to Making Money
