Statistically speaking there is an optimal time to buy or sell a security and knowing such, or at least knowing when not to do so, would be quite beneficial to your financial health. This article provides the answers as to what are the best months, and work its way down to half-hours of the trading day, to engage in trading.
The above introductory comments are edited excerpts from an article* by Frank Holmes (usfunds.com) entitled Anticipate Before You Participate: Patterns in Trading and is the 3rd in a series on what you need to know to be a better investor. See Part 1 (Should Financial Market Cycles Play A Role In Your Decision-making Process?) here and Part 2 (What Role Do Oscillators, Standard Deviation & Mean Reversion Play In YOUR Investment Management Process?) here.
The following article is presented by Lorimer Wilson, editor of www.munKNEE.com (Your Key to Making Money!) and the FREE Market Intelligence Report newsletter (sample here). This paragraph must be included in any article re-posting to avoid copyright infringement.
Holmes goes on to say in further edited excerpts:
It’s vital to know the best months, days and even half-hours of the day to make market transactions. We take a look at each below.
Months
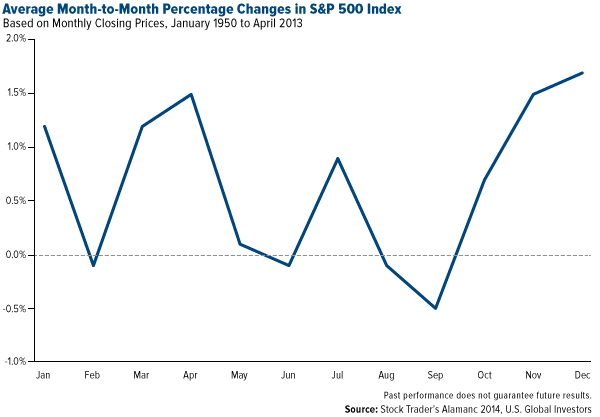
“Sell in May and Go Away” is more than a clever expression…Based on the S&P 500 Index’s monthly closing prices, November, December and January are the best months for trading volume. Conversely, the worst-performing months of the year fall between May and October. Even though the Dow Jones Industrial Average has been up four of the past five Septembers, the ninth month [September] has still been the worst-performing since 1950 for all of the major indexes and exchanges, including the Dow, S&P 500, NASDAQ and Russell 1000 Index.
What the above chart shows is that, in August, September and October, it’s time to “nibble” on stocks, as prices are dropping. In March, April and May, it’s time to “trim.”
As I said, the Dow has been improving slightly in September over the last few years. Its 20-year return has risen to -0.51 percent from its 50-year return of -0.77 percent return.
Theoretically, investing from November 1 through April 30 and then switching to fixed-income products for the rest of the year seems to be a safe and effective strategy. If you back-test this to 1950 with an initial $10,000 investment, you would have gained an estimated 6,740 percent. Investing the same $10,000 from May through October would have cost you $1,024. What a difference six months makes.
I must stress, however, that the above chart, and those that follow, shows only probability. Like a basketball bouncing down a rocky mountainside, nothing is certain, and actual behavior varies. Macro events such as presidential elections, midterm elections and changes in fiscal and monetary policy have a dramatic effect on the outcome of the market…
Weeks
Below you can see the best and worst weeks of the Dow, ranging from 2008 to 2012, and what’s interesting to note is that, even though September is historically the worst month in which to trade, it had three of the best weeks and only one of the worst weeks. Conversely, December, one of the best months in which to trade, had only two of the best weeks. No week in December fell in the “worst” category, however.
| Best 20 Weeks | Worst 20 Weeks | ||
|---|---|---|---|
| Week Ending | % Change | Week Ending | % Change |
| 10/31/2008 | 11.29% | 10/10/2008 | -18.15% |
| 11/30/2011 | 7.25% | 9/23/2011 | -6.41% |
| 11/28/2008 | 9.73% | 08/05/2011 | -5.75% |
| 07/17/2009 | 7.33% | 05/07/2010 | -5.71% |
| 03/13/2009 | 9.01% | 01/24/2014 | -3.52% |
| 10/14/2011 | 4.88% | 11/25/2011 | -4.78% |
| 04/18/2008 | 4.25% | 02/08/2008 | -4.40% |
| 09/16/2011 | 4.70% | 07/29/2011 | -4.24% |
| 07/09/2010 | 5.28% | 10/03/2008 | -4.84% |
| 03/27/2009 | 6.84% | 05/23/2008 | -3.91% |
| 06/30/2011 | 4.02% | 01/18/2008 | -4.02% |
| 08/26/2011 | 4.32% | 06/27/2008 | -4.19% |
| 12/20/2013 | 2.96% | 02/20/2009 | -6.17% |
| 09/13/2013 | 3.04% | 10/24/2008 | -5.35% |
| 01/31/2008 | 3.63% | 06/20/2008 | -3.78% |
| 06/08/2012 | 3.59% | 01/04/2008 | -3.50% |
| 09/03/2010 | 4.33% | 08/19/2011 | -4.01% |
| 12/23/2011 | 3.60% | 05/18/2012 | -3.52% |
| 10/28/2011 | 3.58% | 11/21/2008 | -5.31% |
| 11/23/2012 | 3.35% | 11/14/2008 | -4.99% |
| Source: Stock Traders Almanac 2014, U.S. Global Investors | |||
Days
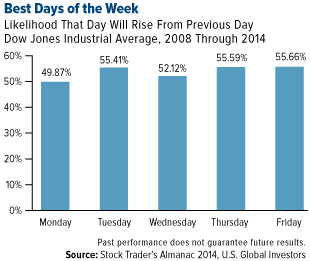 |
Which day is the best to buy? Which day is the best to sell? That depends on whether we’re talking about days of the week, days of the month, days preceding or following holidays—there are innumerable contexts and implications to consider…[That being said,] the strongest days tend to fall on the 9th, 10th and 11th trading days of the month.
To the right you can see…[which days of the week the Dow is most likely to rise]. Between 2008 and 2014, Mondays have been the weakest, rising less than 50% of the time—the only trading day to fall more than it rises, in fact.
Intraday (Hours & Half Hours)
a) Intraday Performance of the TSXV
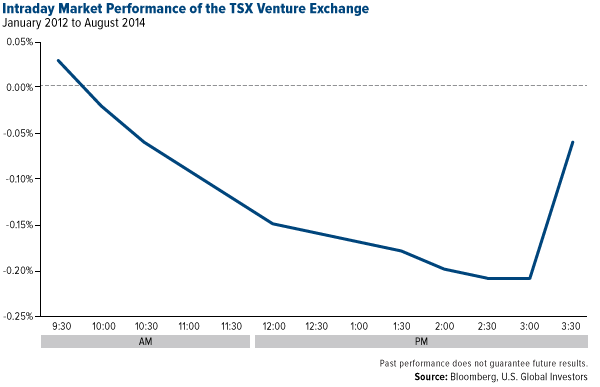
What you see below is the intraday market performance of the TSX Venture which has a market capitalization of over $37 billion and represents approximately 2,250 small-cap companies, many of them in the mining and metals space…
With the TSX Venture, it’s generally smarter to sell rather than buy in the morning. Over the last two and a half years, this is when prices tend to be high. There’s heavy volatility as the market is reacting to what might have happened since the previous trading day’s closing bell. Unless you really know what you’re doing in this particular market, if you buy in the morning, you can often expect to see your shares sink as the day unfolds.
The “safest” time to buy would be in the late afternoon. The market has cooled somewhat and traders are gauging where things might be headed. The challenge during this time, however, is that volume has dipped and, as a result, spreads have widened.
b) Intraday Performance of the GDXJ ETF
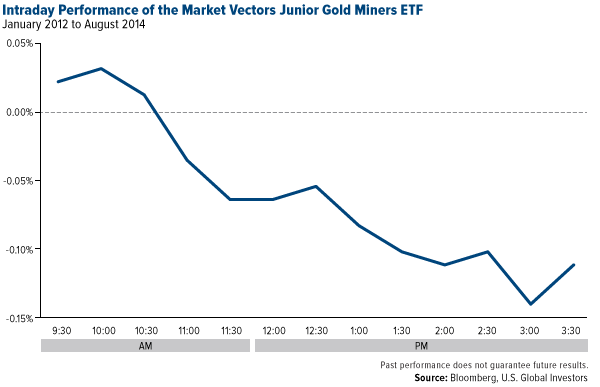
…[in] the intraday performance chart below of the Market Vector Junior Gold Miners ETF [GDXJ], which gives investors exposure to small and intermediate gold and silver companies, [you will note that] prices are highest in the morning, decrease throughout the afternoon and then get a final boost starting around 3:00. Making a trade at 9:30, then, will have a vastly different outcome than making one at 1:30.
Again, these charts are imperfect and show only probability. Trading activity can fluctuate widely, especially prior to and after earnings and economic announcements, and there will always be the unforeseen event—a workers’ strike, a CEO’s termination or resignation, civil unrest—that shakes up the market.
Intraday Performance of the NASDAQ 100 ETF (QQQ)
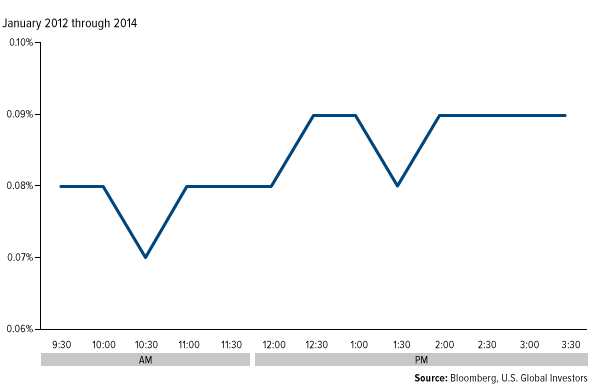
Now compare the TSX Venture and Market Vectors Junior Gold Miners ETF, both of which have their own DNAs of volatility, to the NASDAQ 100 ETF, which tracks the 100 largest and most active non-financial and international companies listed on the greater NASDAQ—in other words, blue chip stocks.
Over the same time frame as the previous indexes, the pattern here has almost reversed. Relative lows in the morning. Modest improvement throughout the trading day. You could, in this market, reasonably buy in the morning and sell in the afternoon.
Conclusion
You don’t have to be as obsessed and intuitive with statistics and patterns…but if there’s one thing I want to leave you with, it’s that research must be conducted on the market you’re planning to trade in before you enter.
Editor’s Note: The author’s views and conclusions in the above article are unaltered and no personal comments have been included to maintain the integrity of the original post. Furthermore, the views, conclusions and any recommendations offered in this article are not to be construed as an endorsement of such by the editor.
*http://www.usfunds.com/investor-library/investor-alert/#.VAHUzFV0zIU (©2014 U.S. Global Investors, Inc. All Rights Reserved.)
If you liked this article then “Follow the munKNEE” & get each new post via
- Our Newsletter (sample here)
- Twitter (#munknee)
Related Articles:
1. Part 1: Should Financial Market Cycles Play A Role In Your Decision-making Process?
Financial markets are influenced by relatively predictable cycles…[and should] play a big role in one’s decision-making process just as they do in our day-to-day lives. This article, part 1 of a 3 part series, takes a look at several and discusses their relevance to one’s investment management process.
In the investment management process…[it is important to] actively monitor both short- and long-term cycles…in order to manage expectations based on historical patterns…[as well as] oscillators – diagnostic tools that help us measure a security’s upward and downward price volatility. To understand how oscillators work, though, you first need to become familiar with standard deviation and mean reversion. In this article, part 2 of a 3-part series, we do just that.
3. Time the Market With These Market Strength & Volatility Indicators
There are many indicators available that provide information on stock and index movement to help you time the market and make money. Market strength and volatility are two such categories of indicators and a description of six of them are described in this “cut and save” article. Read on! Words: 974 Read More »
4. Yes, You Can Time the Market – Use These Trend Indicators
Remember, the trend is your friend and now you have an arsenal of such indicators to make an extensive and in-depth assessment of whether you should be buying or selling. If ever there was a “cut and save” investment advisory this article is it. Words: 1579 Read More »
5. Make Money! Time the Market Using Market Strength Indicators- Here’s How
There are many indicators available that provide information on stock and index movement to help you time the market and make money. Market strength and volatility are two such categories of indicators and a description of six of them are described in this “cut and save” article. Read on! Words: 974 Read More »
 munKNEE.com Your Key to Making Money
