Below is a description of what I believe to be the best stock market indicator – ever. I am referring to the percentage of S&P 100 stocks above their 200 DMA which gives traders a clear early warning signal of impending serious market downturns and later safe re-entry points.
So says John Carlucci, a guest contributor to advisorperspectives.com, in edited excerpts from his original article* entitled Best Stock Market Indicator Ever: Weekly Update.
The following article is presented by Lorimer Wilson, editor of www.munKNEE.com (Your Key to Making Money!) and the FREE Market Intelligence Report newsletter (sample here) and has been edited, abridged and/or reformatted (some sub-titles and bold/italics emphases) for the sake of clarity and brevity to ensure a fast and easy read. This paragraph must be included in any article re-posting to avoid copyright infringement.
Carlucci goes on to say in further edited excerpts:
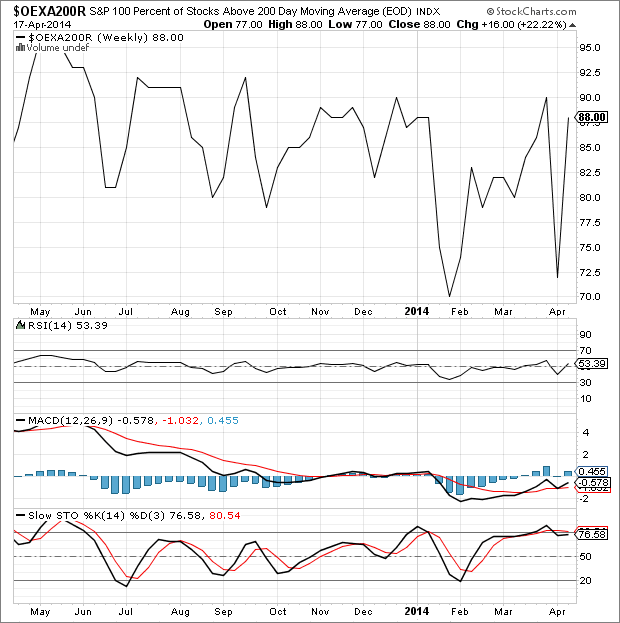
The percentage of S&P 100 stocks above their 200 DMA ($OEXA200R) metric is a technical indicator available on StockCharts.com used to find the “sweet spot” time period in the market when you have the best chance of making money. It accurately assesses the state of the market, whether we are in a bull, a bear or transitioning from one to the other, as well as market volatility and risk within each of those situations, in order to make profitable trading decisions. Simply put, the OEXA200R gives traders the ability to identify the most opportune conditions within which to execute their various long, short or hold strategies.
The weekly charts below are current through last week’s close.
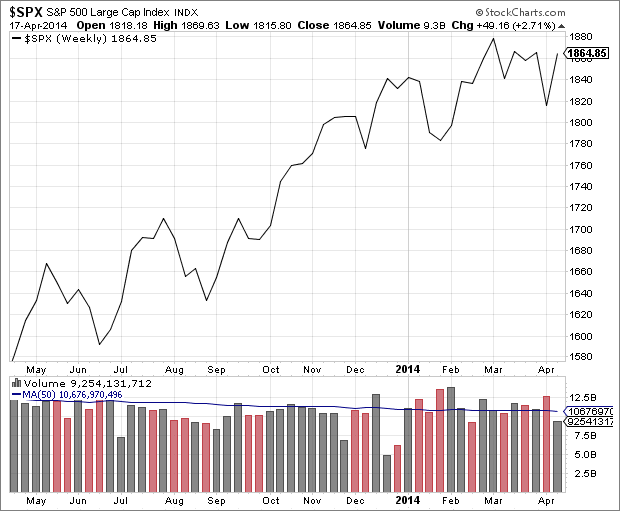
Weekly OEXA200R vs. S&P Comparison
Interpretation:
According to this system, the market is now tradable. The OEXA200R ended the week at 88%, up from 72% last weekend.
Of the three secondary indicators:
- RSI is POSITIVE (above 50).
- MACD is POSITIVE (black line above red).
- Slow STO is NEGATIVE (black line below red).
Background on How I Use This Indicator
a) When Daily $OEXA200R rises above 65% (I follow the Daily but do not publish the chart here) and 2 of the following 3 also occur:
- Weekly RSI rises over 50
- Weekly MACD black line rises above red line
- Weekly Slow STO black line rises above red line
conditions for re-entry are safe.
Without the solid foundational support of two out of three Weekly secondary indicators it is unsafe to trade even if Daily OEXA200R edges above the 65% line. The market is considered safely tradable as long as Daily OEXA200R remains above 65% and two Weekly secondary indicators remain positive. Volatility and risk for long traders are relatively low. The trend is on their side.
b) Conversely, when Daily OEXA200R drops to 65% and/or 2 out of 3 Weekly secondary indicators turn negative it is taken as the conservative signal to exit all long positions, even if Daily OEXA is above 65%.
Volatility and risk increase substantially. In the past, this has often been a “tipping point” condition presaging a substantial market drop. For simplicity sake, just look for the notice in the “Interpretation” section above as to whether the market is either “Tradable” or “Un-tradable”.
Editor’s Note: The author’s views and conclusions in the above article are unaltered and no personal comments have been included to maintain the integrity of the original post. Furthermore, the views, conclusions and any recommendations offered in this article are not to be construed as an endorsement of such by the editor.
* http://www.advisorperspectives.com/dshort/guest/John-Carlucci-Best-Indicator-Ever-Update.php (© John F. Carlucci & © 2014, Advisor Perspectives, Inc. All rights reserved.)
 munKNEE.com Your Key to Making Money


