Electrum is a gold and silver alloy found in nature, with traces of copper, platinum and other metals. Thus begins the story of this very long and close relation between gold and silver. It is said that a picture is worth a thousand words, so let us analyze this relation between gold and silver with some graphs.
So says Dan Popescu (goldbroker.com) in his original article* entitled The Gold/Silver Ratio – Gold, Silver, and their Relationship which is quoted below.
[The following is presented by Lorimer Wilson, editor of www.munKNEE.com and may have been edited ([ ]), abridged (…) and/or reformatted (some sub-titles and bold/italics emphases) for the sake of clarity and brevity to ensure a fast and easy read. This paragraph must be included in any article re-posting to avoid copyright infringement.]
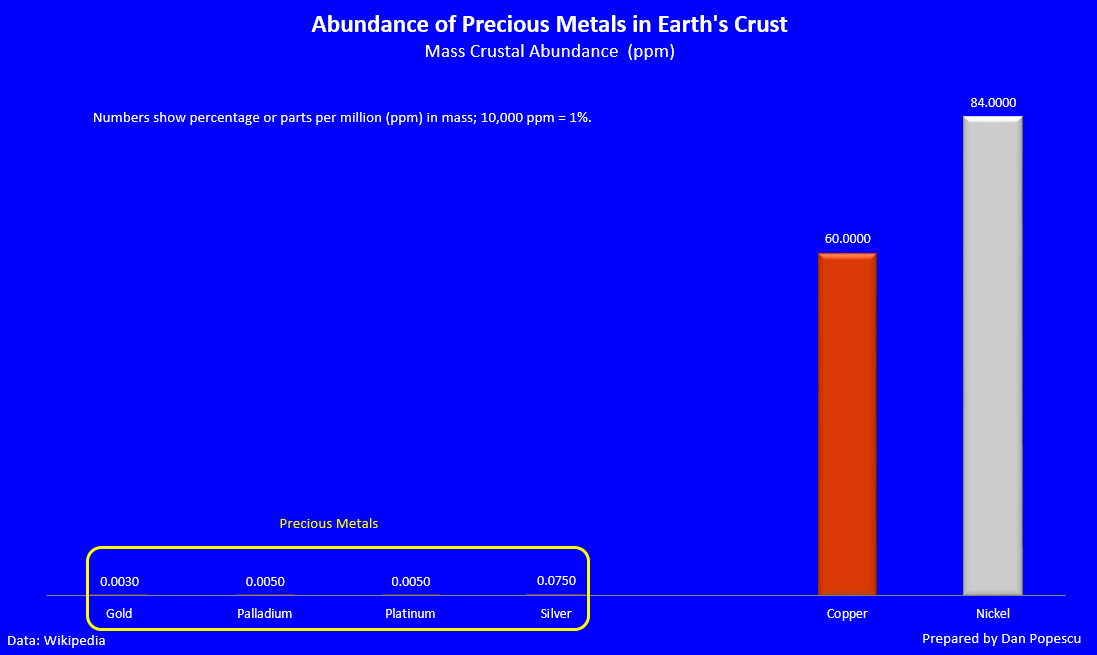
“Graph #1 shows why gold, silver, platinum and palladium are considered precious metals, by comparing them to other metals such as copper and nickel. The abundance of non-precious metals is obvious. Copper is 800 times more abundant than silver, which is the most abundant precious metal.
Graph #1: Abundance of precious metals vs non-precious metals in the Earth’s crust
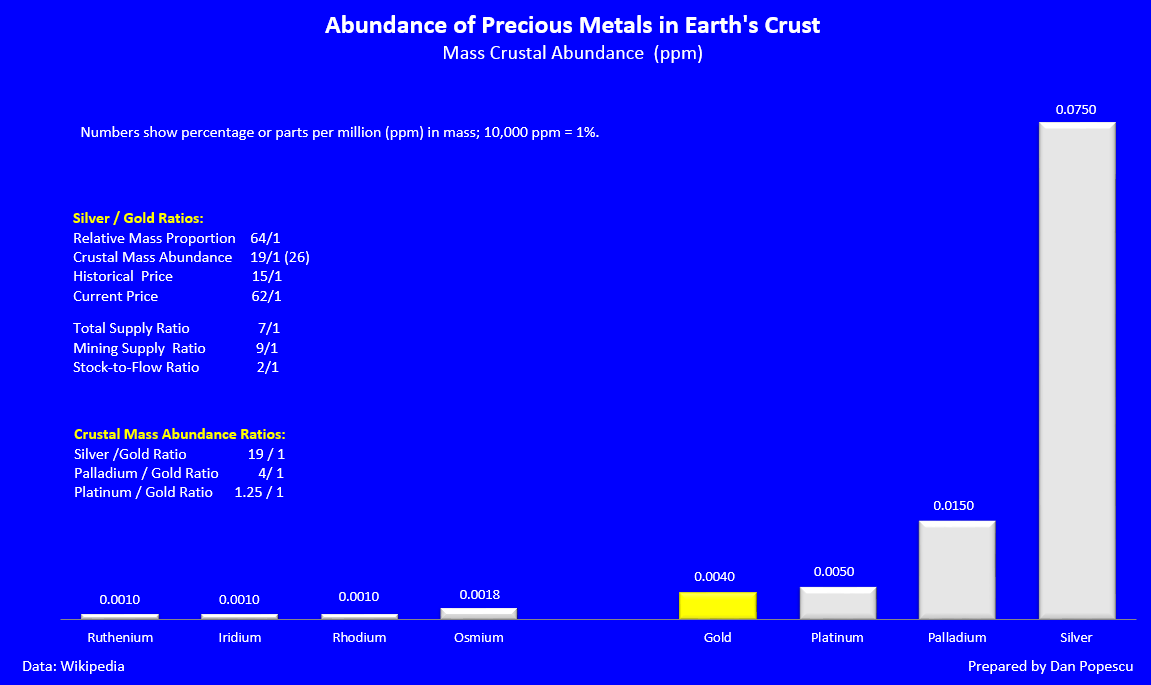
If we take a closer look to precious metals in graph #2, we observe that gold is rarer than platinum and that silver is the most abundant one. The gold/silver ratio is 19/1, whereas the platinum/gold ratio is 1.25/1. Even though platinum is 1.25 times more abundant than gold in the Earth’s crust, 16 times more gold is extracted than platinum.
In regards to the relationship between gold and silver, we observe great variations in the ratio. Even though there is 19 times more silver than there is gold in the Earth’s crust, only 9 times more silver than gold is extracted today. The historical 15/1 gold/silver ratio is closer to their abundance ratio of 19/1. One must not forget, however, that the historical 15/1 ratio has always been fixed or imposed by the state, one-way or the other, and never by the markets.
Graph #2: Abundance of precious metals in the Earth’s crust
Relative mass proportion ratio = 64/1
Abundance in weight ratio in the Earth’s crust = 19/1
Total supply ratio = 7/1
Mining only supply ratio = 9/1
Historical price ratio = 15/1
Actual price ratio = 62/1
Stock/flow ratio = 2/1
Let us take a closer look at the stock, supply and demand factors for gold and silver, to see if they can justify the historical ratio of 15/1 or the actual market ratio of 62/1.
If we look at graphs #4 and #5, we realize that the silver stock is twice the gold stock. However, it is important to know that the silver stock is much harder to get back into the market than gold’s, because it is not stored in its simplest form, contrary to gold. A lot of silver is wasted.
If we study the gold and silver supply, we observe that the total silver supply in relation to gold is 7/1, and the mining supply ratio is 9/1. 60% of the gold market and 75% of the silver market are fed by mining production.
50% of silver’s demand is industrial, whereas industrial demand for gold represents only 10% of the market. It is important to know that industrial demand consumes the metal and makes it hardly recoverable and, consequently, costly in terms of time and money.
According to Ted Butler, silver market analyst, known silver reserves have shrunk 95% since the end of World War II. This is due to a persistent deficit between supply and demand that is continuing today. This known deficit is remarkable, since there has been steady growth of silver world production in the last 50 years, but not enough to satisfy growing industrial demand. [I am sorry, but graphs #3 and #4 will not reproduce so please visit the original article* for details.]
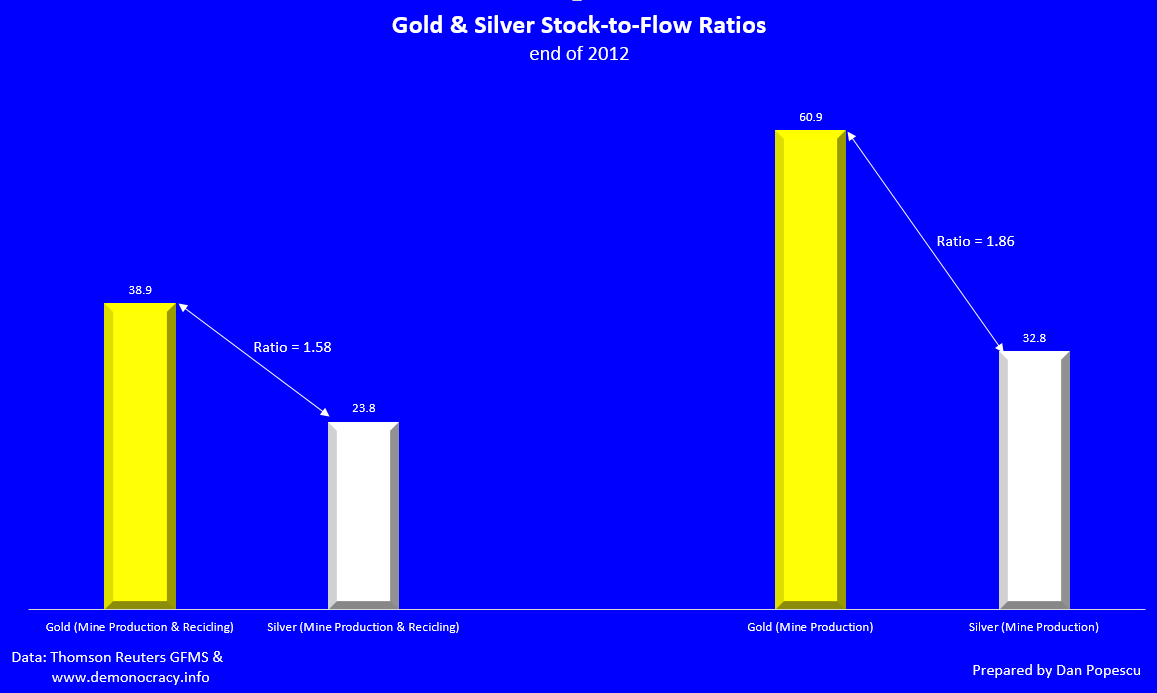
Now, let us compare (graph #5) the stock/flow ratio of the two precious metals. It is approximately 2/1 in relation to the total market or the mining production. This means that the stock is twice as menacing in the gold market than in silver’s and, once again, this stock is much more liquid than silver’s. Moreover, the silver stock is quickly dwindling, whereas gold’s is practically constant, or augments only slightly.
Graph #5: Gold/silver ratio of stock/flow (total and mining production only)
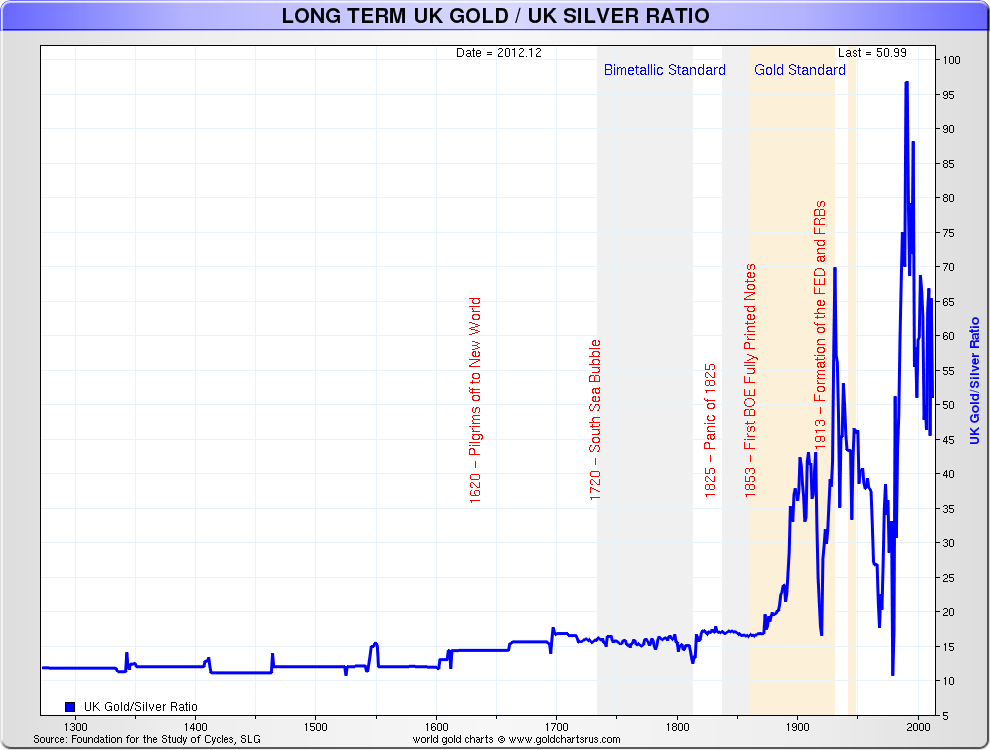
Graph #6 shows us the gold/silver price ratio since 1260, that is 750 years of history. We can see that the ratio has stayed almost constant for about 600 years, around 15/1. This is because it has been fixed by the state and not by the market. Since the moment when silver lost its monetary aspect, it has become a simple commodity. On the other hand, gold has remained a monetary metal, and its price has been officially fixed until 1971. Since gold and silver prices became free, we can observe that the ratio started to fluctuate enormously, going from 10/1 to close to 100/1. However, one must not neglect the fact that, even if the gold price is not fixed officially anymore, it still is a monetary metal for central banks, whereas they own almost no more silver. The relation between gold and silver changed around 1876, when the bi-metallic standard ended. Silver then stopped to be a medium of exchange, while gold remained the currency of last resort and a store of value.
Graph #6: The gold/silver ratio
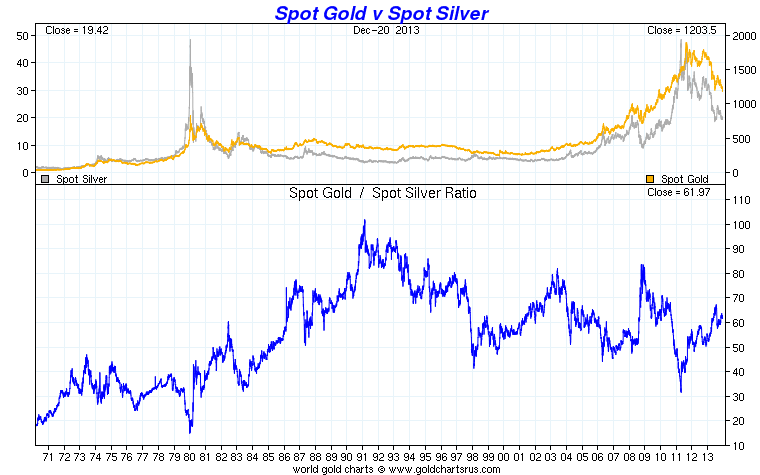
Since the gold price is no more fixed, the ratio has fluctuated between 10 and 100, without indicating a trend or a cycle. This can be explained, as far as I am concerned, by the fact, that the two metals have different stock, supply and demand parameters that determine their prices and one must, consequently, study them separately.
Graph #7: Spot gold vs spot silver ratio
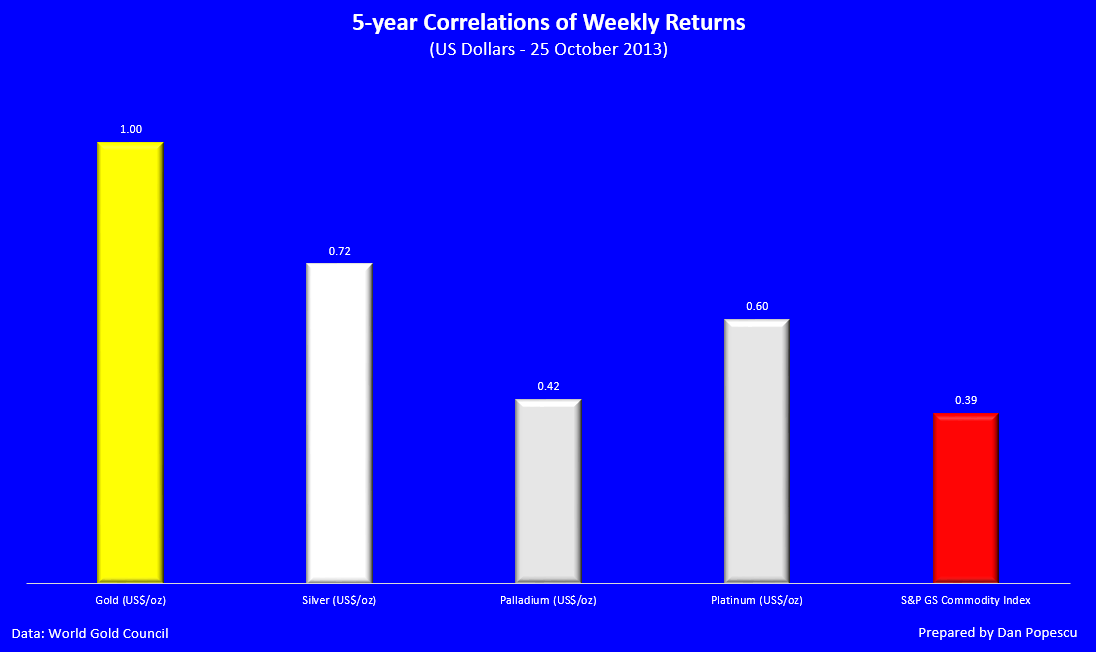
However, there is one exception (see graph #8), because there is a great correlation between the prices of gold and silver. It is the highest correlation of any metals, and it has been 72% in the last five years. This, I think, can be explained by the fact that we are in the midst of a financial crisis and that a collapse of the present monetary system is probable. This has caused a staggering rise in the price of gold that was followed by a transfer of funds toward silver by those who couldn’t afford to buy gold. This is the reason why silver is called “poor man’s gold”. The higher the gold price, the higher the correlation with silver.
Graph #8: Correlations (over five years) of weekly returns in US dollars
Silver’s price never moves independently from gold, despite its fundamentals. Silver’s monetary aspect dictates its price at this moment. Silver investors are much the same as gold investors, in that they focus mainly on the monetary aspect of silver, instead of its industrial aspect. If gold ever makes a return in the international monetary system, silver will be traded as a currency, though it will not, I believe, become actual currency.
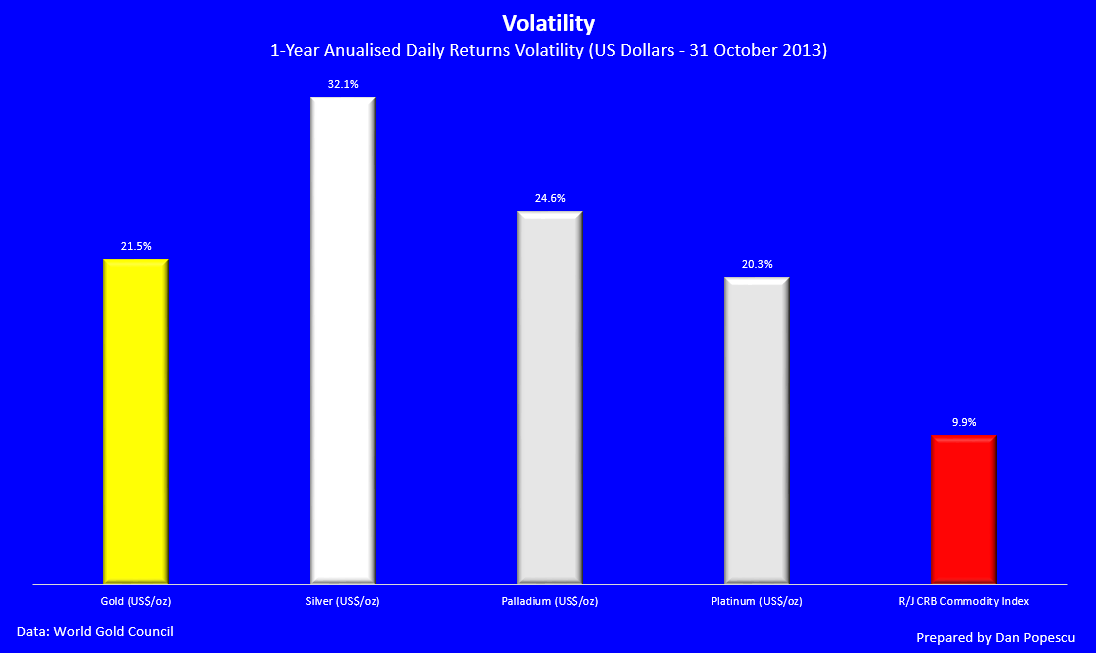
We must also observe, in graph #9, that silver is 10% more volatile than gold. This is why Roy Jastram has nicknamed silver the “restless” metal and gold the “constant” metal.
Graph #9: Volatility (one year) of annualized daily returns
Let us look now at how gold and silver behaved during the last great speculative bubble in the precious metals, during the 1970-1980 period. We can see, in graphs #10 and #11, that the gains have been almost similar for gold (2,382%) and silver (2,144%), but that the following plunge has been steeper for silver. It is obvious that the precious metals bull market that started in 2000 cannot yet be considered as a speculative bubble. Since 2000, gold has gone up only by 395% and silver by 398%. I believe the speculative phase hasn’t begun yet. I think it will begin only when gold will have crossed the $2,000 mark, and then it will reach maybe a level of around $5,000, whereas silver will probably reach $100.
Graph #10: Gold Bull Market – 1970 vs 2000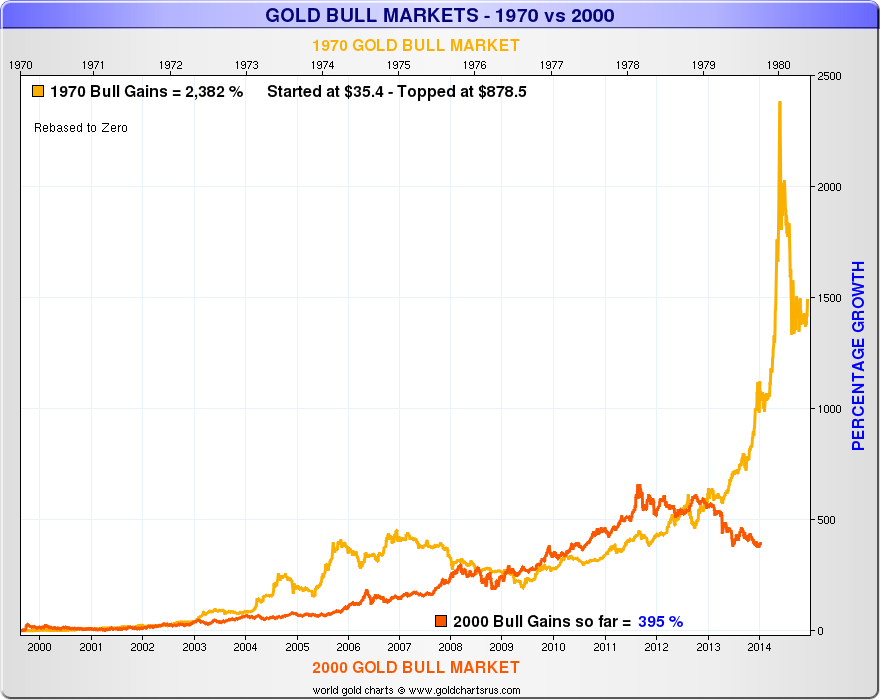 |
Graph #11: Silver Bull market – 1970 vs 2000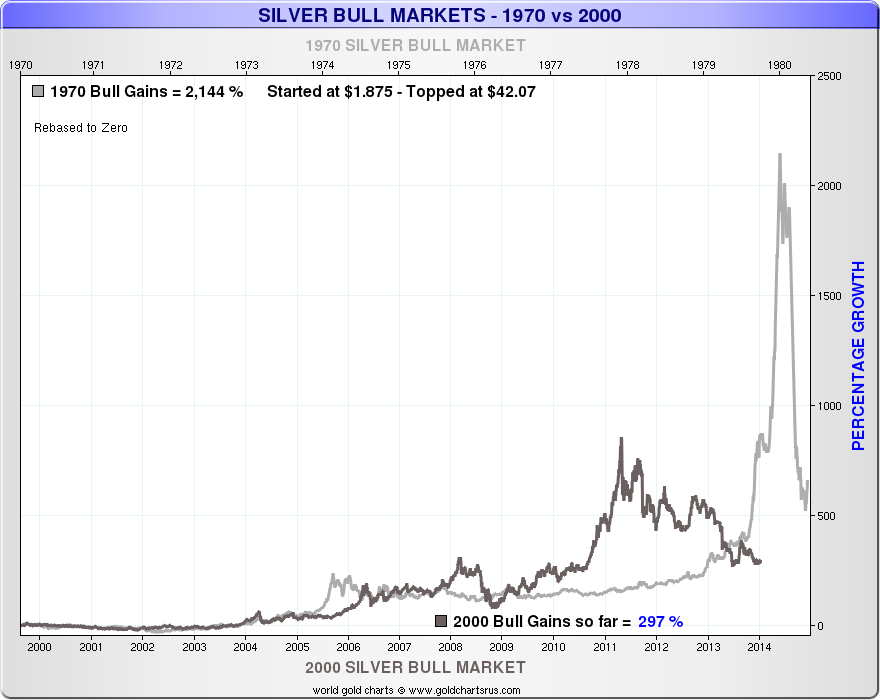 |
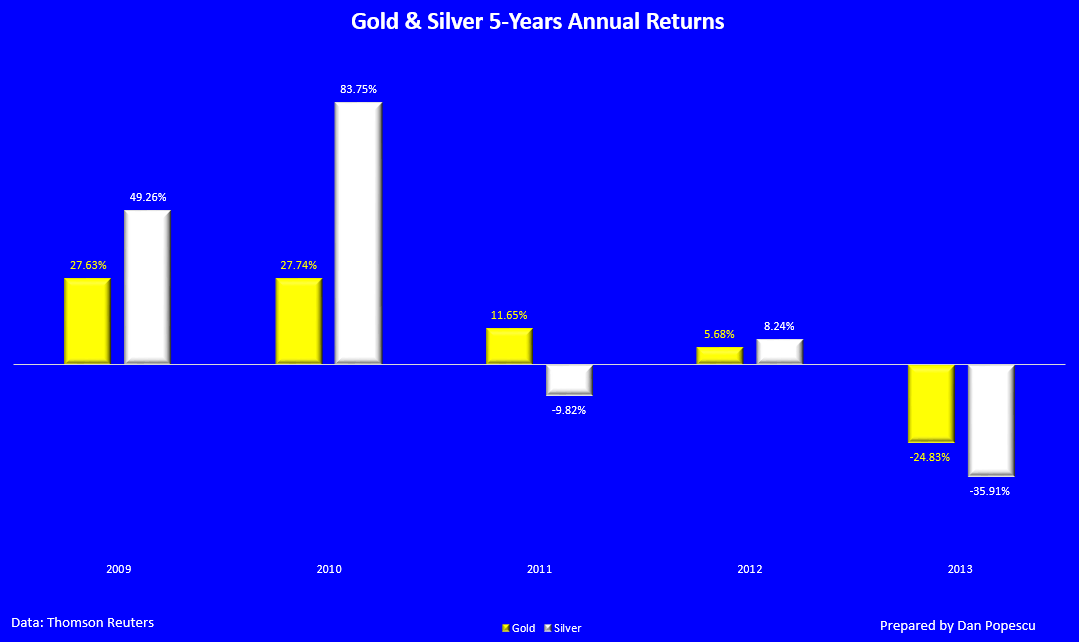
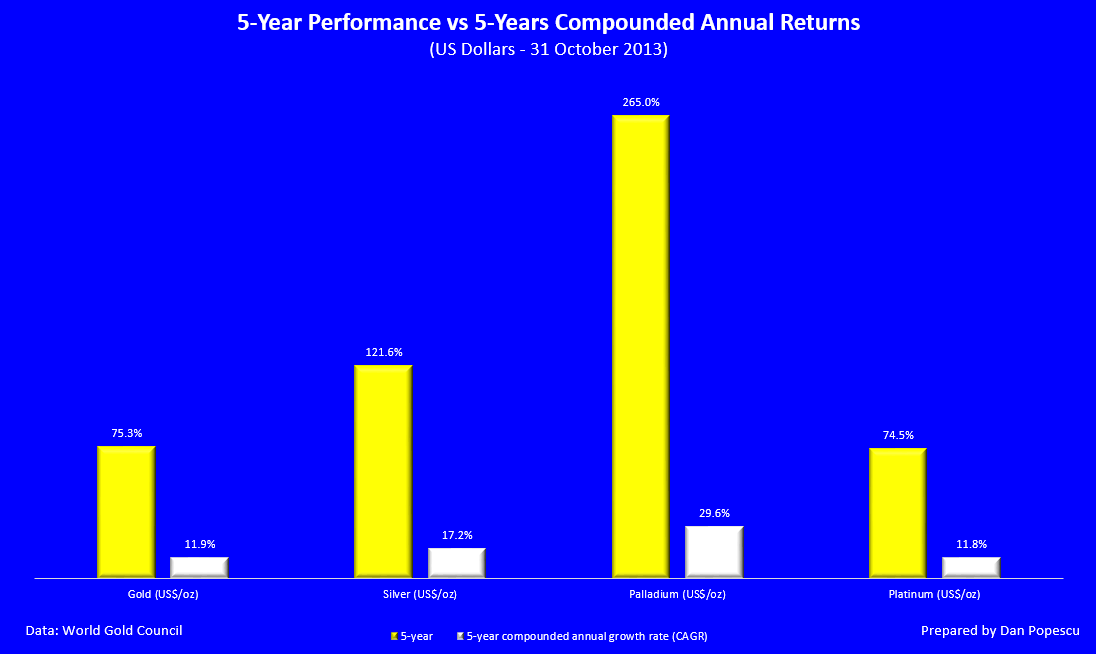
For the last five years, the annual return on silver has outperformed the return on gold, but during the recent takedown (2013), its price corrected more violently (graphs #12 and #13).
Graph #12: Annual returns over five years
Graph #13: Performance of precious metals over five years
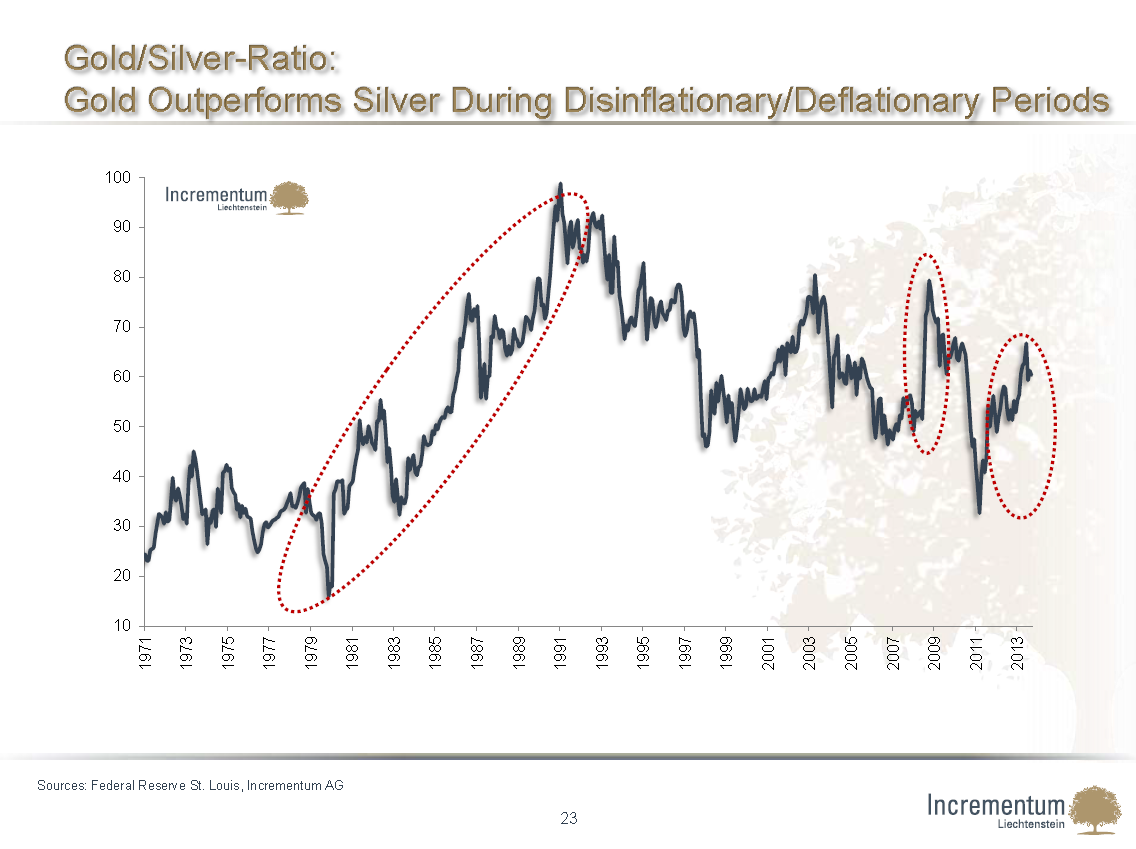
As it can be seen in graph #14, gold outperforms silver in disinflation/deflation periods.
Graph #14: Gold/silver ratio: Gold outperforms silver in disinflation/deflation periods
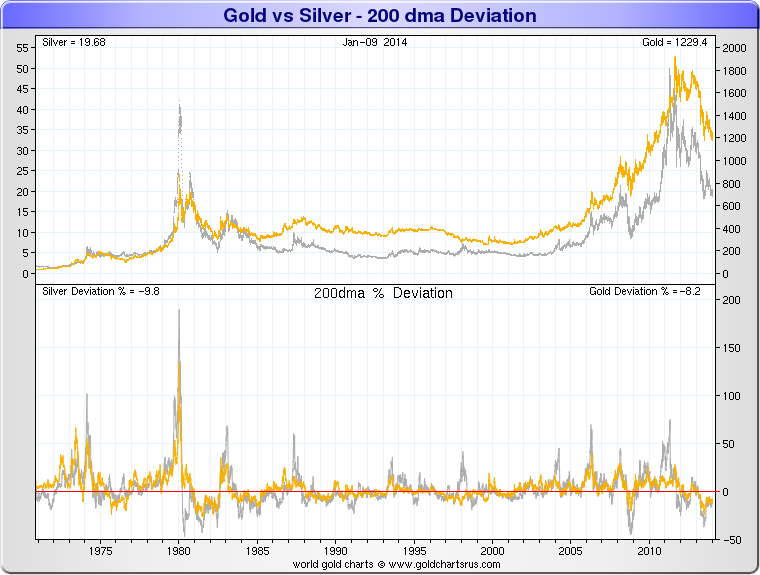
The relation between gold and silver changed around 1876 when the bi-metallic standard ended and silver stopped being a medium of exchange. However, it is obvious that the correlation between them is as strong as it has ever been. One just needs to look at graph #15 to realize that, even after the demonetization of gold in 1971, the correlation has remained just as strong. However, it is the monetary crisis that gave gold the leadership, and with silver following with much greater volatility. Between 1969 and 1980, the correlation coefficient between the prices of gold and silver was 0.9267. Between 2001 (when silver was at its lowest) and today (2013), the correlation coefficient was 0.8106. Which means that almost 2/3 of the silver price moves in this secular bear market and 7/8 of its moves in both bull markets since 1971 are due to the changes in gold’s price.
Graph #15: Gold vs silver and the 200-day moving average deviations
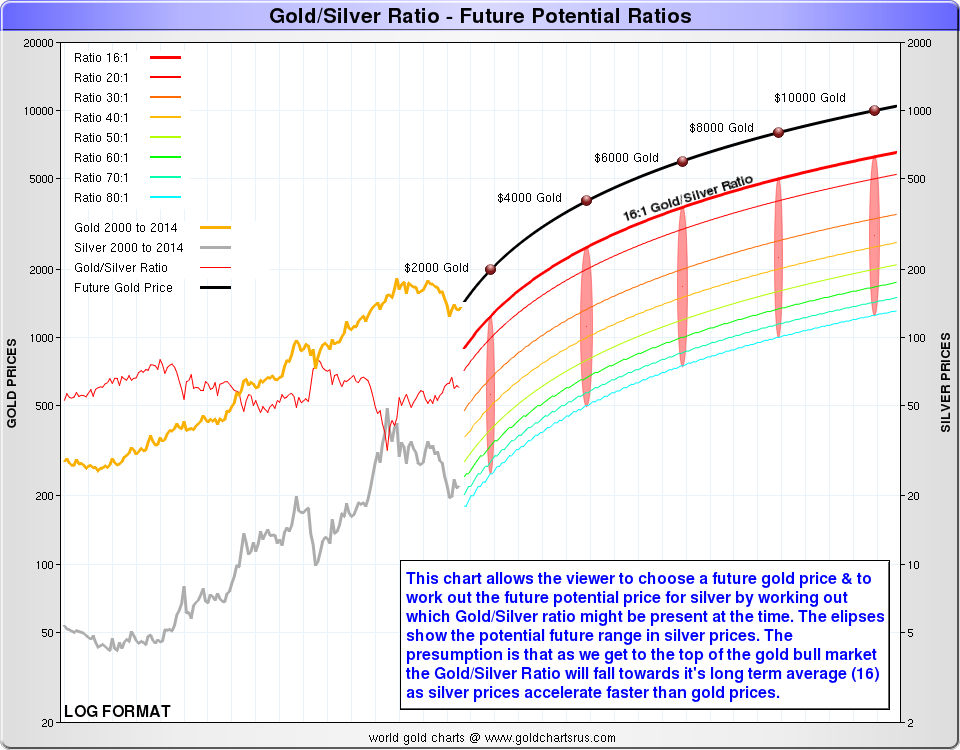
Graph #16 represents several projections of gold and silver prices with different gold/silver ratios going from 16/1 to 80/1. I think there is no reason why the gold/silver ratio should come back to 15/1 or any other level. Both gold and silver have their own stock, supply and demand characteristics, but there remains a very strong correlation between them. The crisis in the international monetary system is going to push both precious metals to much higher prices within five years. The gold/silver ratio will perhaps decline in the coming years, but not by much (maybe 50/1), and certainly not all the way to 15/1 or even 20/1. Such a ratio would have to be mandated, as it has been the case for 600 years, but I doubt very much that it would happen.
Graph #16: Potential prices at different gold/silver ratios
Until the crisis in the international monetary system is resolved, the monetary aspect of silver will dominate its industrial aspect, and gold will keep its leadership role. As the silver price goes up, the more the industrial demand will decline, while the monetary demand will rise. The question is, in what proportions will this happen. Central banks and sovereign funds will dominate the gold market, whereas private investors will mainly dominate the silver market. There is no central bank that I know of that is buying silver today for its monetary reserves. Gold remains mainly a monetary metal, whereas silver has, above all, become an industrial metal that, in a monetary crisis like todays, can play a monetary role, as “poor man’s gold”.
In conclusion, I think there is no worthy reason to believe that the gold/silver ratio will come back to its historical level. Gold and silver have their own markets; they sometimes converge and they sometimes diverge, but there is always an important correlation between the two.”
[Editor’s Note: The author’s views and conclusions in the above article are unaltered and no personal comments have been included to maintain the integrity of the original post. Furthermore, the views, conclusions and any recommendations offered in this article are not to be construed as an endorsement of such by the editor.]
*https://www.goldbroker.com/en/news/gold-silver-ratio-relationship-between-precious-metals-413 (GoldBroker.com © 2011-2014; All rights reserved)
Related Articles:
1. Gold:Silver Ratio Suggests Much Higher Future Price for Silver – MUCH Higher!
The majority of analysts maintain that gold will reach a parabolic peak price somewhere in excess of $5,000 per troy ounce in the next few years. Given the fact that the historical movement of silver is 90 – 95% correlated with that of gold suggests that a much higher price for silver can also be anticipated. Couple that with the fact that silver is currently greatly undervalued relative to its average long-term historical relationship with gold and it is realistic to expect that silver will eventually escalate dramatically in price. How much? This article applies the historical gold:silver ratios to come up with a range of prices based on specific price levels for gold being reached. Words: 691 Read More »
2. These Sites Are the BEST Places to Buy Gold & Silver Online – Here’s Why
Our review of the best places to buy gold online…[are] dependent on what your goal with the gold is — amassing physical bullion for financial security or to speculate on gold prices. Below are strategies and recommended dealers for each approach: Words: 532 Read More »
 munKNEE.com Your Key to Making Money


The bottom line for me is no matter which PM is your favorite, should the value of PM’s zoom upward, your portfolio is going to remain very secure, unlike all those that chose to not invest in PM’s, who will be complaining about their decision for the rest of their lives!
Got PM’s?