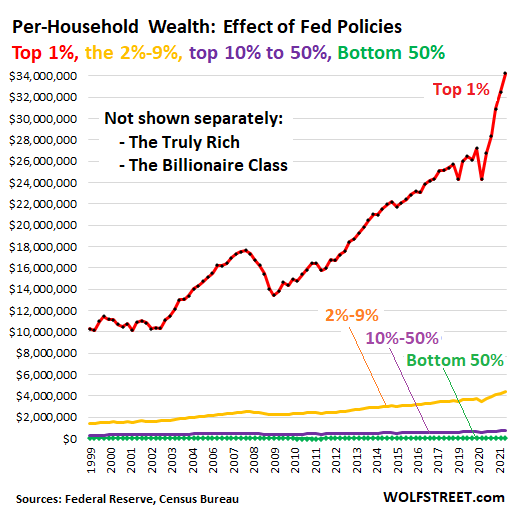
Last Friday (October 1st), the Fed released detailed data about the wealth of households by wealth category for the 1%, the 2% to 9%, the “next 40%” (the top 10% to 50%) and the “bottom 50%” for the second quarter of 2021 and it showed…It wasn’t households in general that benefited, but only the richest households with the most assets. This article has those details.
My Wealth Effect Monitor divides the wealth (assets minus liabilities) for each wealth category by the number of households in that category, which produces average per-household wealth within each category.
- The wealth of the bottom 50% – 63.2 million households – is reflected by the jagged green line on the bottom and they are worth on average $47,900 per household. This number, however, includes $25,970 in “durable goods” (cars, phones, furniture, etc.), which for consumers are normally considered consumables, not assets, because their values are declining, and they don’t produce incomes and, of the $7,900 per household gained over the quarter, $2,085 came from purchases of durable goods!

- Not shown separately in the above graph are the truly rich – the 0.01% – and the Billionaire Class. The Fed wisely doesn’t provide any information on them separately, but includes them in the Top 1%, but, according to the Bloomberg Billionaires Index, the top 30 US billionaires are worth on average $69 billion per household currently, having gained on average $2.2 billion in wealth each over the quarter.
…The wealth disparity between the top 30 billionaires on average and the bottom 50% grew by yet another $2.2 billion per household, to $69.2 billion…and the wealth disparity within the 1%, from the average top 30 billionaires to the least wealthy among the 1% also grew by around $2.2 billion to $69.2 billion because the bottom end of the 1% still own only peanuts compared to the Billionaire Class…
Among the bottom 50% there are also large differences:
- At the top end are households perhaps with a modest house weighed down by a big mortgage, a small 401k, plus cars and other durable goods, minus auto loans, student loans, and credit card debt.
- That category also includes the poorest of the poor who face the soaring housing costs and other costs that are a result of the wealth effect by using their credit cards to tide them over. They have on average very little money left over to put aside and buy stocks with…
The Fed’s doctrine of the “Wealth Effect”
The Fed’s doctrine of the “Wealth Effect” is designed to enrich the top 10%, particularly the top 1%, particularly the top 0.01%, and particularly the Billionaire Class. The more they have, the more they benefit. This is official Federal Reserve policy and during the pandemic, the Fed went all-out: It printed $4.5 trillion in 18 months and repressed short-term interest rates to near-zero, in order to inflate asset prices to the extreme, and it succeeded.
This was the greatest economic injustice committed in recent U.S. history….[and] the bottom 50% don’t understand what the Fed is doing to them, don’t even know what the Fed is and does, and they are too busy trying to survive in this economy that the Fed has so powerfully rigged against them.
…My Wealth Effect Monitor tracks that economic injustice. Below, it shows the difference in wealth between the 1% and the bottom 50%.

Asset price inflation is the cause of the disparity illustrated above. The more they have, the more they get. The bottom 50% don’t have anything and need not apply…
Editor’s Note: The original post by Wolf Richter has been edited ([ ]) and abridged (…) above for the sake of clarity and brevity to ensure a fast and easy read. The author’s views and conclusions are unaltered and no personal comments have been included to maintain the integrity of the original article. Furthermore, the views, conclusions and any recommendations offered in this article are not to be construed as an endorsement of such by the editor. Also note that this complete paragraph must be included in any re-posting to avoid copyright infringement.
A Few Last Words:
- Click the “Like” button at the top of the page if you found this article a worthwhile read as this will help us build a bigger audience.
- Comment below if you want to share your opinion or perspective with other readers and possibly exchange views with them.
- Register to receive our free Market Intelligence Report newsletter (sample here) in the top right hand corner of this page.
- Join us on Facebook to be automatically advised of the latest articles posted and to comment on any of them.
 munKNEE.com Your Key to Making Money
