…I don’t doubt that the S&P 500 will rise to 5,000 – someday – but it just isn’t likely to be this year or next. Let’s logically think about this and just where the two keys to market would need to be for 5,000 to be realistic, which are earnings and the PE.
The S&P 500, based on analysts’ consensus estimates, is forecast to earn $212.92 over the next twelve months. If the S&P 500 were to rise to 5,000, it would mean the S&P 500 would have a PE ratio of 23.5. On Dec. 31, 1999, the S&P 500 had a PE of 24.8. We know how that ended. That’s a very high ratio – even today’s PE is exceptionally high.
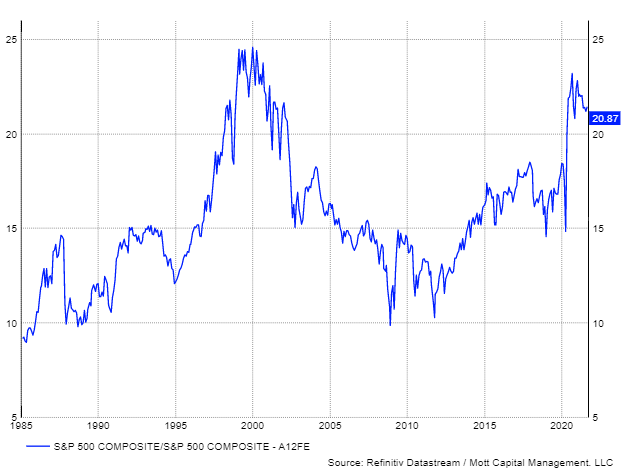
For the S&P 500 to have an average PE, let’s say 17, the index would need to have earnings of $294.12 per share, a 38% increase from the current estimates. That seems like a high hurdle to get over during the next 12 months, or the next 18 months, for that matter, when GDP growth is decelerating and returning to something more around its historical growth rate.
The Market Is Anything But Healthy
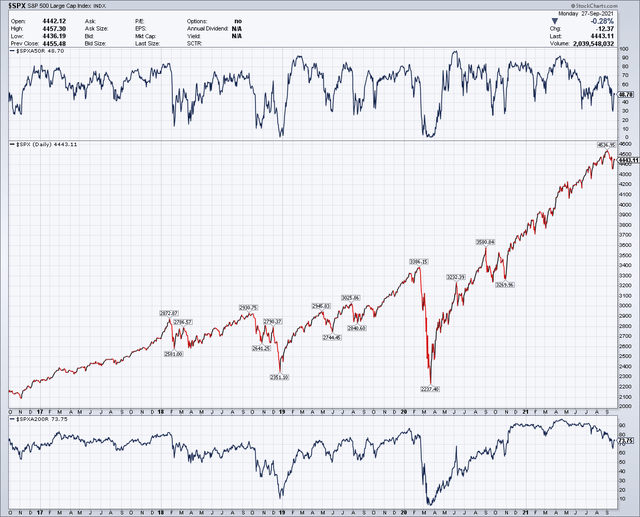
The market from internal metrics is anything but healthy. If you looked at the internals, you would think this market already was down 10% or more. The percentage of stocks in the S&P 500 above their 50-day moving average is just 48%, while those above their 200-day moving average are around 73%. More importantly, these metrics have been deteriorating for months, indicating that the market’s overall health has been falling apart for months.
The last time the percentage of stocks above their 50-day moving was this low or lower was in the fall of last year when the S&P 500 was trading well off its highs.
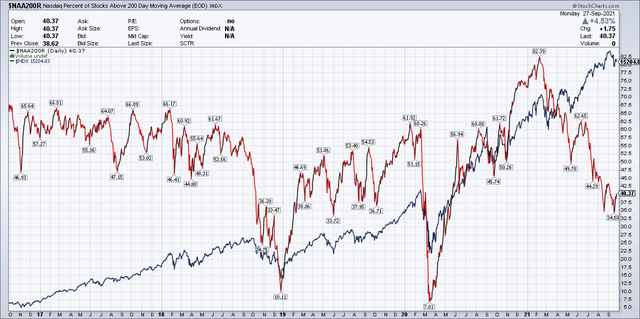
Unfortunately, it is even worse for the Nasdaq, with the percent of stocks above their 200-day moving average at 40%. Historically, when the percentage of stocks below their 200-day moving has fallen this low, it has been associated with drops of more than 10%, like in the May of 2019 or heading into the fall of 2018.
Economically Sensitive Sectors Have Collapsed
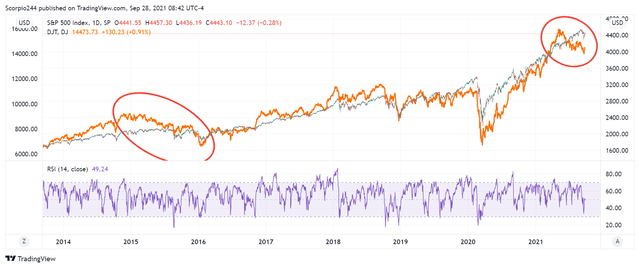
Meanwhile, the more economically sensitive market parts have warned us of trouble for months, like housing and transports. These sectors have been crushed. The last time we saw the S&P 500 and the HGX Housing index diverged by such large amounts was heading into the fall of 2018. The housing sector has now fallen nearly 15% from its May peak.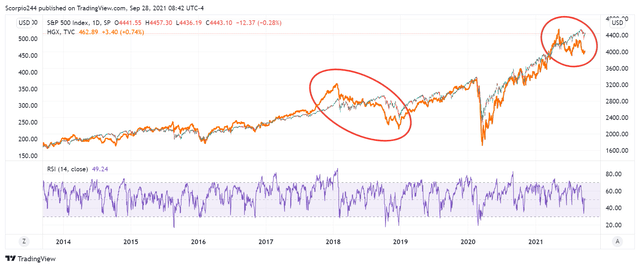
Meanwhile, the Dow Jones Transportation Average has fallen by more than 10% from its May peak. The last time the transports have diverged this much from the S&P 500 happened as moved into the fall of 2015 and the earnings recession that accompanied it.
Tapering
By the way, at the start of 2015, the Fed had just completed tapering QE for the first time. That was a period where the market did nothing for almost 2-full years and just chopped around, while the PE ratio collapsed, falling from 17.4 in the fall of March 2015 to Aug. 15, 2015.
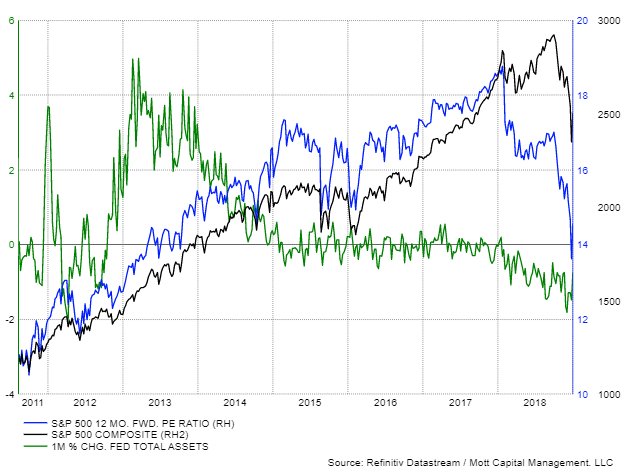
The big difference is that today, the PE multiple is much higher than in 2015. The PE ratio fell by nearly 14% during the 2015 period. With the PE much higher this time around, it seems entirely possible that the decline in the PE multiple could be more significant than in the 2015 cycle.
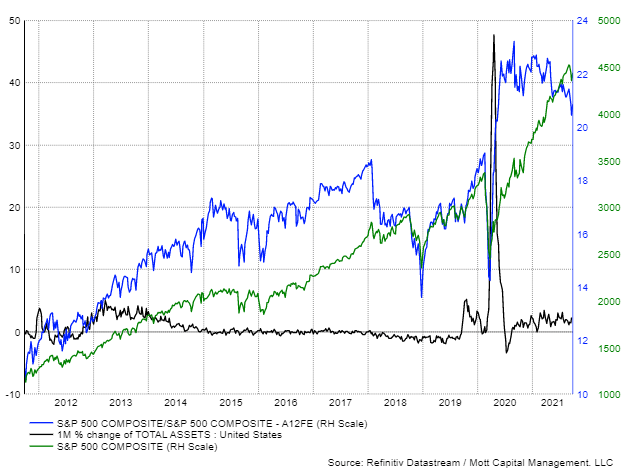 What also happened in that 2015 cycle was that financial conditions tightened tremendously. These tighter conditions led to a massive amount of volatility in the stock market. Those financial conditions today are just as easy as they were back at the start of the 2015 tightening cycle. It would seem highly likely that those conditions are only likely to tighten from here, creating the same turbulence.
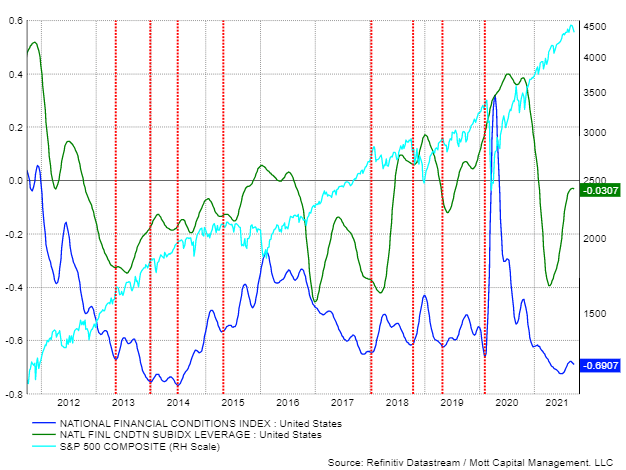
When considering the current state of the market and diving into things like valuations, internals, sector rotation, the Fed, it’s hard to imagine how it is that people can think the market is healthy or can push even higher. It looks pretty sick, and it has looked this way for months…
Editor’s Note: The original post by Mott Capital Management has been edited ([ ]) and abridged (…) above for the sake of clarity and brevity to ensure a fast and easy read. The author’s views and conclusions are unaltered and no personal comments have been included to maintain the integrity of the original article. Furthermore, the views, conclusions and any recommendations offered in this article are not to be construed as an endorsement of such by the editor. Also note that this complete paragraph must be included in any re-posting to avoid copyright infringement.
A Few Last Words:
- Click the “Like” button at the top of the page if you found this article a worthwhile read as this will help us build a bigger audience.
- Comment below if you want to share your opinion or perspective with other readers and possibly exchange views with them.
- Register to receive our free Market Intelligence Report newsletter (sample here) in the top right hand corner of this page.
- Join us on Facebook to be automatically advised of the latest articles posted and to comment on any of them.
 munKNEE.com Your Key to Making Money
