“…There has been…[a great deal of] research done recently on the cost of illegal immigrants to the economy and to society…[and the results are surprising and encouraging.]”
Prepared by Lorimer Wilson, editor of munKNEE.com – Your KEY To Making Money! [Editor’s Note: This version* of the original article by Kevin Wilson has been edited ([ ]), restructured and abridged (…) by 66% for a FASTER – and easier – read. Also note that the original author is receiving compensation from Seeking Alpha for pageviews of his original unedited article as posted there so please refer to it for more detail.]
“At issue are a whole range of questions, including at least the following:
- whether immigrants are a drag on the economy;
- whether immigrants take the jobs of “native” Americans;
- whether immigrants cause a systematic decrease in the wages of the native-born;…
- whether immigration is needed to offset declining birth rates and support the Social Security system;
- and whether the changing composition of immigrants has placed undue costs on the welfare and healthcare systems.
…Leaders from both the Democrat and Republican parties have long endorsed:
- the important role played by immigration in the economic and cultural history of America,
- the great benefits that immigrants continue to bring to the country today,
- the notion that immigration should be allowed only under controlled conditions,
- and that some regulation of the border itself is necessary.
…We find ourselves in a situation [today, however,] in which:
- as many as 22 million illegal immigrants have come into the country, and those who are deserving have no pathway to citizenship;
- many native-born workers are fearful of the impacts on wages and employment of relatively unfettered and ever-increasing mass immigration;
- the widespread public perception (but apparently not the reality) that violent crime has increased significantly due to illegal immigration;
- the immigration system is wildly inefficient and therefore completely bogged down, with a court backlog of over 750,000 cases;
- and the political system is so dysfunctional that nothing significant has been accomplished by Congress in addressing these concerns since 1990…
For investors, there are several issues worth paying attention to in the immigration debate:
- Foremost amongst these is the need for continued immigration to keep population growth on track…[as] the only two drivers for GDP growth are population increase and productivity growth, and both will have to improve for growth to rise above (and stay above) the rather tame levels of the recent recovery. [Indeed,] one of the main reasons the U.S. economy has outperformed Europe over the last few decades has been the strong immigration advantage enjoyed by the U.S. over that time period.
- Another issue worth…[noting] is the…huge benefit accruing to the U.S. economy from the legal immigration of highly skilled and/or highly educated workers…
- Finally, the apparent fiscal cost of immigration with respect to welfare and healthcare benefits for poor immigrants in the early years of their U.S. residency appears to be a significant factor in the short run…
Empirical Data on the Economics of Immigration
One of the politically strongest arguments against immigration has historically been the notion (and widespread belief) that:
- new immigrants take jobs from native-born Americans.
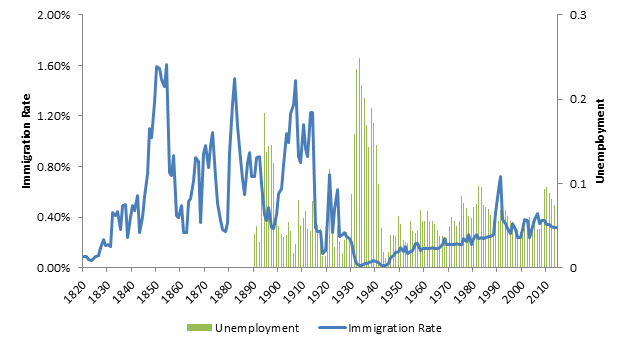
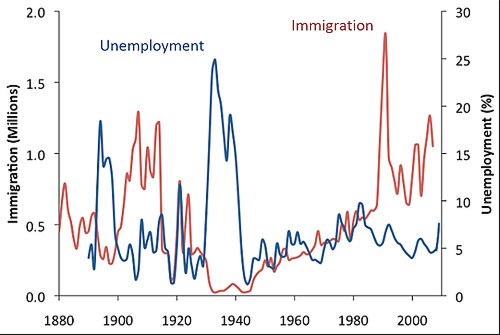
Census Bureau and “BLS” data indicate, however, that years with higher immigration do not coincide with those years characterized by higher unemployment (Chart 12). In fact:
- since 1890, unemployment is generally highest when immigration is relatively low…
- the two biggest spikes in unemployment occurred during depressions before 1950…[although,] since 1950, the relationship is less clear cut.
Chart 12: Immigration Rates and Unemployment (see first 11 charts from original article here)
 Source
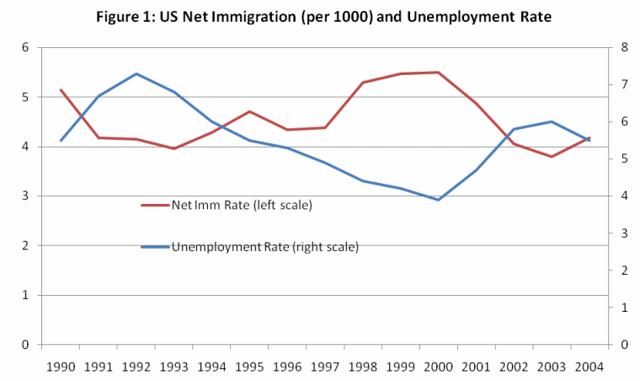
Zooming in on the 1990-2004 period (Chart 13), there still seems to be a mildly inverse correlation between unemployment and immigration rates.
Chart 13: Immigration Rates Mildly Inversely Correlated To Unemployment, 1990-2004
 Source
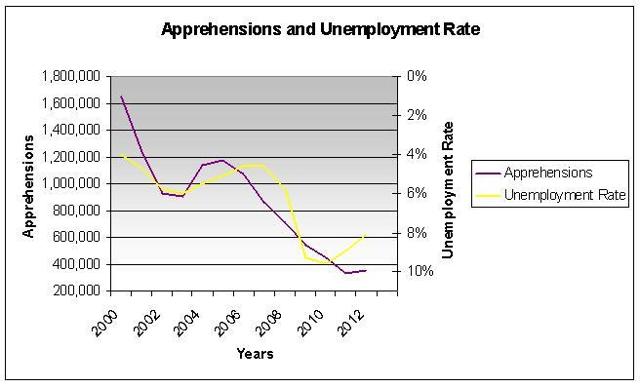
…If we look at apprehensions of illegal immigrants versus unemployment from 2000 to 2012 (Chart 14), we observe at least some confirmation of an inverse correlation between unemployment and immigration.
Chart 14: Illegal Immigrant Apprehensions Inversely Correlated to US Unemployment (2000-2012)
 Source
Surprisingly though, during the period from 1940 to 1982, there appears to be a long-term positive correlation between unemployment and immigration (Chart 15). Thus, it would appear that the correlation between immigration and unemployment is episodic in nature and highly variable, for unknown reasons.
Chart 15: Unemployment and Immigration Positively Correlated, 1940-1982
 Source
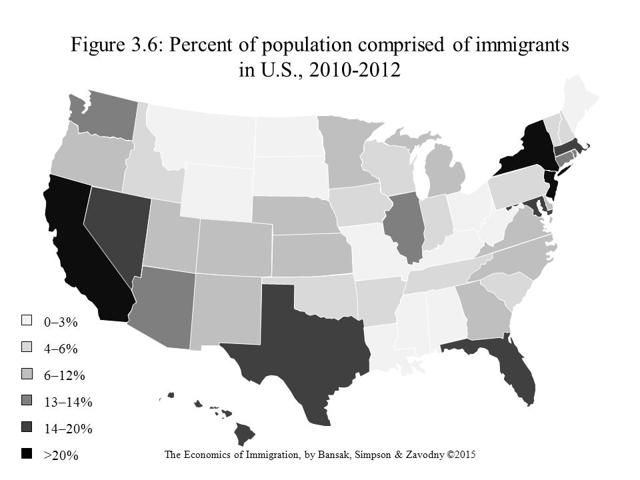
Another issue in the analysis of unemployment (and all other economic data related to immigration) is the fact that the distribution of immigrants across the country is quite patchy, with some states receiving huge influxes and others almost none (Chart 16)…
Chart 16: Immigration Impacts Fall Mainly on Just A Few States
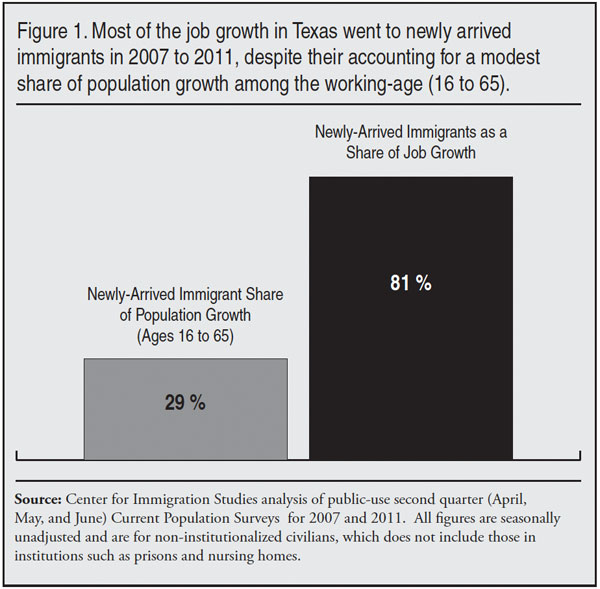
Texas, [for example,] is a big border state with big illegal immigration problems, as well as having plenty of legal immigration due to its strong economy and large, well-funded universities. For the period from 2007 to 2011 (recession and early recovery), immigrants comprised 29% of population growth in Texas but took an 81% share of job growth (Chart 17). This may simply reflect the temporary economic situation associated with the Great Recession, or it may be of more general application; it’s hard to say based on the limited data available.
Chart 17: Newer Immigrants in Texas Enjoyed Most of the State’s Job Growth, 2007-2011
…Some have claimed that there may be times and places where immigrants do, in fact, take jobs away from certain types of American workers:
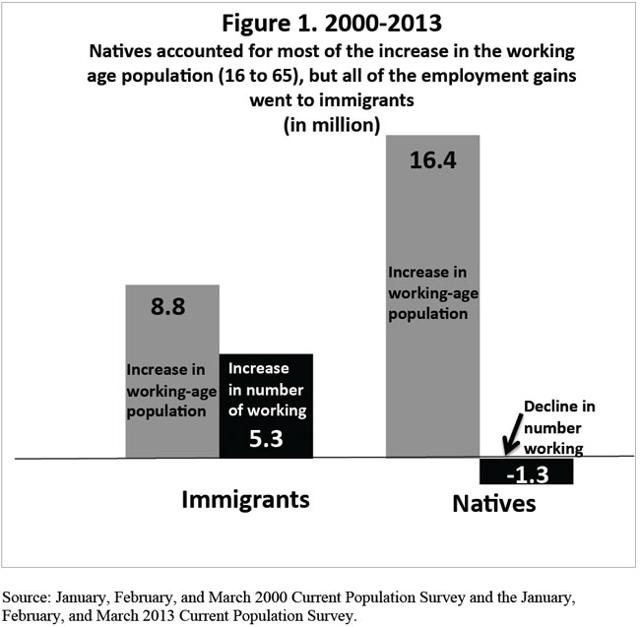
- The Center for Immigration Studies [did a study that]…shows that between 2000 and 2013, virtually, all net employment gains went to immigrants (Chart 18), despite the fact that the native-born accounted for the majority of the increase in the working-age population.
Chart 18: Some National Data Suggest Immigrants Took All the Employment Gains, 2000-2013
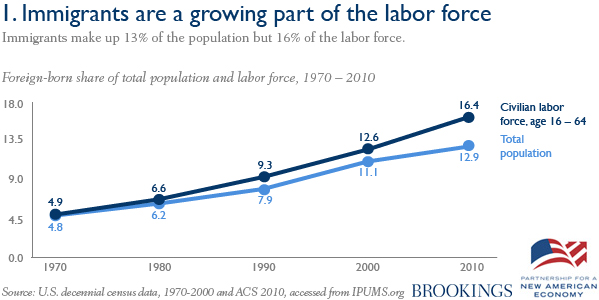
- A…Brookings Institution study (Chart 19) indicated that immigrants gained an increased share in the available labor force from 1970 to 2010, and this would appear at first glance to have come at the expense of the native-born.
Chart 19: Immigrants Have Gained Share in the Labor Force Since 1970
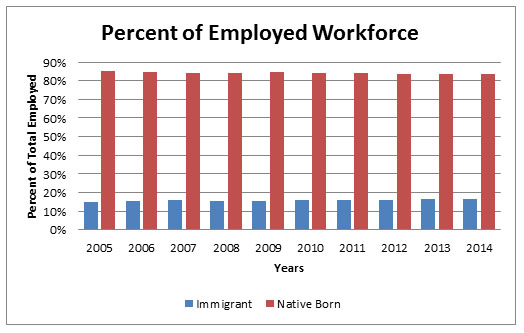
- …[A] study… by the Cato Institute (Chart 20) has suggested that the number of foreign-born workers actually employed has essentially remained unchanged in the period from 2005 to 2014, at a time when all forms of immigration were climbing…
Chart 20: Almost No Change in Actual Employed Work Force Composition, 2005-2014
 Source
Note the subtle difference between the data sets in Charts 19 and 20.
- …[Chart 19 measures] the available work force,
- …[Chart 20 measures] those in that work force who’re actually employed.
…More foreign labor is available then, but it does not appear to be (in these data sets) fully employed. This is almost certainly because the supply of unskilled labor in some locations has exceeded demand, forcing many immigrants onto the welfare rolls initially upon arrival, as discussed below.
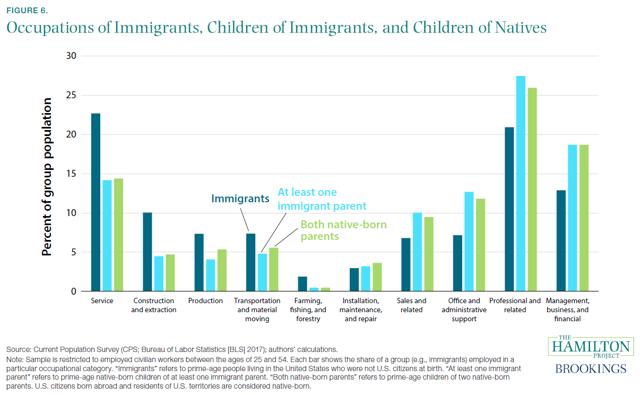
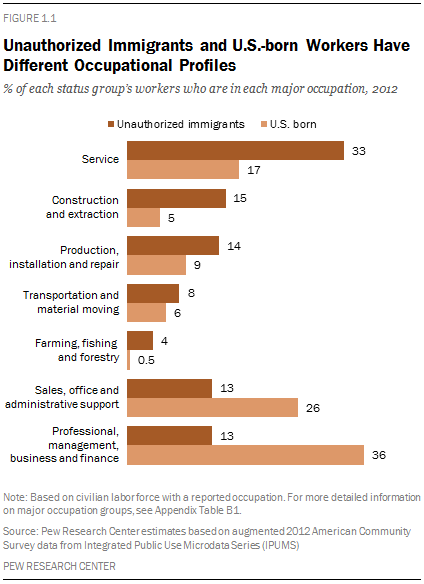
…Immigrants are heavily employed in the:
- service,
- construction,
- extraction,
- professional,
- and management
sectors of the economy (Chart 21). The first three of these sectors attract many unskilled and semi-skilled workers, as well as some highly skilled workers; the last two sectors attract mainly highly skilled and more highly educated workers.
Chart 21: Occupations of Immigrants and Their Children
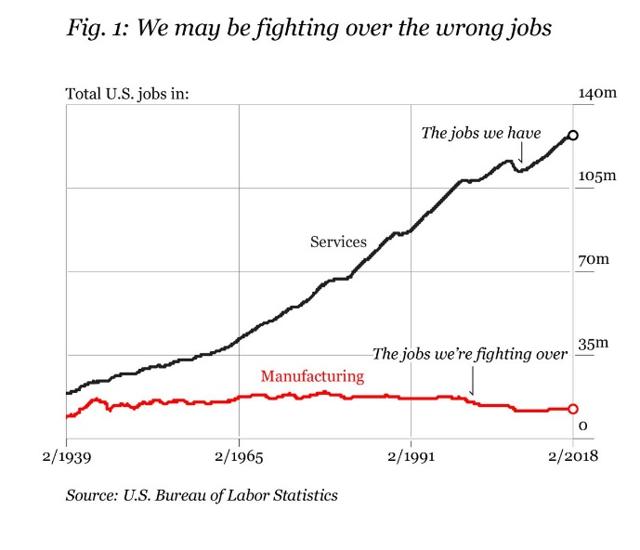
Most illegal immigrants work in the first three sectors so, if jobs in the service, construction, and extraction sectors are more in supply at times than jobs in other sectors, immigrants will tend to preferentially benefit. Indeed, it does seem that service sector jobs are the main ones available in recent years anyway (Chart 22).
Chart 22: Service Sector Jobs Dominate Employment Data
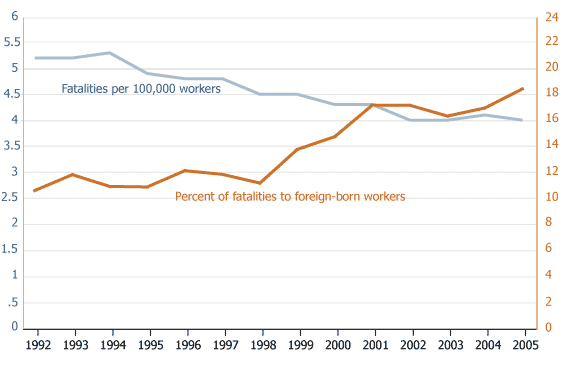
 Furthermore, it is widely believed that illegal immigrants have mainly taken jobs Americans don’t want. Certainly, this seems to be confirmed by statistics on hazardous jobs and job-related fatalities (Chart 23).
Chart 23: Foreign-Born Workers Increasingly More Likely To Be Killed on the Job
 Source
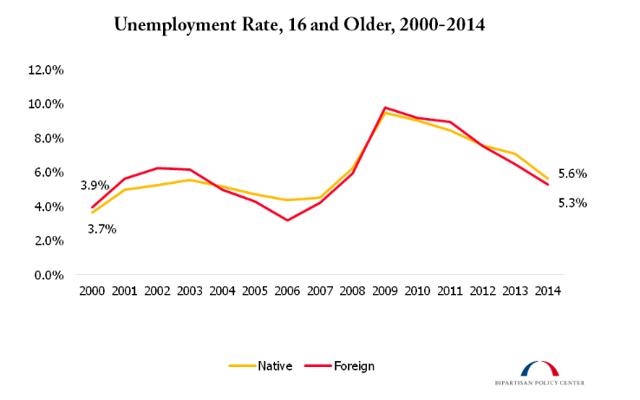
If foreign-born workers are taking jobs that Americans actually want in significant quantities, why do their unemployment rates so closely track those of the native-born (Chart 24)?
Chart 24: Unemployment Rate for Foreign-Born Workers Closely Tracks That for the Native-Born
 Source
Additional confirmation of the findings on job losses to immigrants (Charts 18 & 19 above) has thus been hard to find. It appears that immigrants take mainly service, construction, and extraction sector jobs that Americans don’t want, or at least don’t prefer.
The skill sets of native-born and illegal immigrant workers do not closely align, and thus they do not appear to be competing for the same jobs in many cases (Chart 25).
Chart 25: Illegal Immigrants Do Not Compete Proportionally for the Same Jobs as Those Sought by Native-Born Workers
Charts 26 & 27 (from the original article)
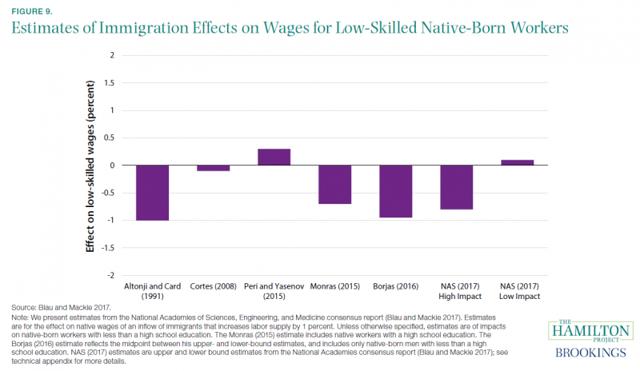
With respect to the widespread claims made that immigrants cause the wages of native-born workers to be depressed, there is at least some supporting evidence…(Chart 28), it amounts to only -1% or even less than that…
Chart 28: Some Studies Suggest Low-Skilled Native-Born Workers Have Lost Only About 1% in Wages Due to Immigration Impacts
Almost all of that negative wage differential falls on those without a high school diploma (Chart 29), who actually appear as a cohort to lose almost 5% in wages.
Chart 29: Native-Born Workers with No High School Diploma Are the Hardest Hit by Immigration
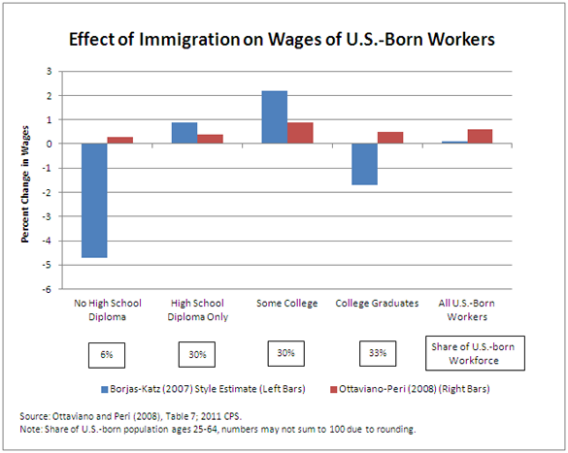
Indeed, one well-known researcher has concluded that the lost wage effect is far bigger than the -1% loss most studies have reported (e.g., George J. Borjas, 2016; Op. cit.)…
- if low-skilled native-born workers are losing significant wages, then that money is, in effect, transferred to their employers, who gain directly from lower wages.
- Offsetting this lower wage effect somewhat is the fact that:
- immigrant workers help boost GDP because they buy goods and services, which of course benefits everyone to some extent.
- Also, over half of illegal immigrants are actually working “on the books,” and therefore paying income and payroll taxes (Pia Orrenius, 2006; Op. cit.).
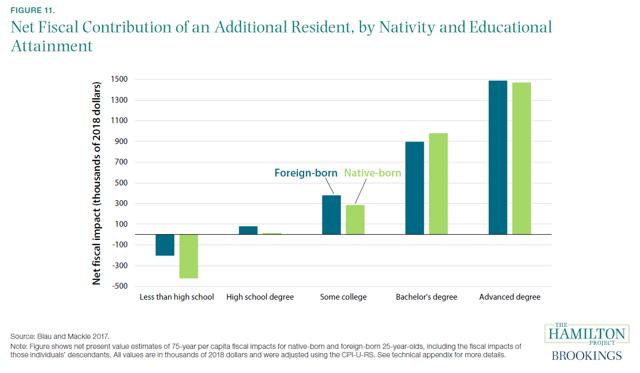
The issue of immigrants putting a strain on the welfare and healthcare systems is a serious one. National studies by academics have long maintained that foreign-born residents have little long-term (lifetime) cost (i.e., negative fiscal impact) to native taxpayers (Chart 30) unless these immigrants lack a high school education.
Chart 30: Net Fiscal Contribution of Immigrant And Native-Born Cohorts
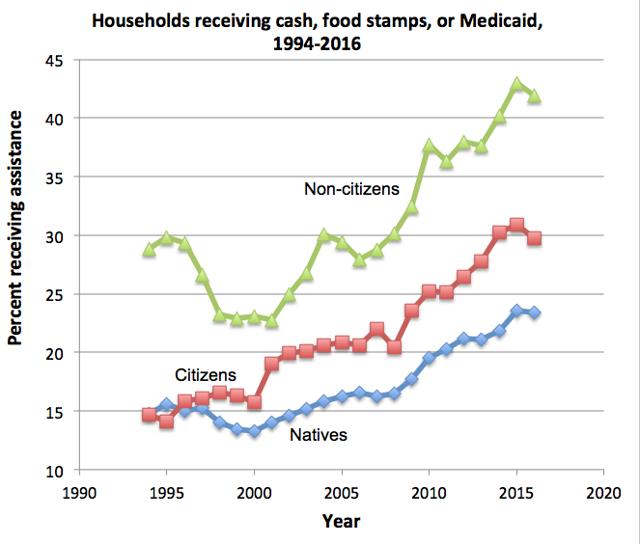
However, the well-respected economist George Borjas has presented recent data indicating that new immigrants and naturalized citizens use far more social services as a percentage (Chart 31) than the native-born do. This is probably mainly due to the relative poverty and lack of education of many illegal immigrants when they first arrive.
Chart 31: New Immigrants and Naturalized Citizens Use Social Services at Higher Rates Than Natives Do
 Source
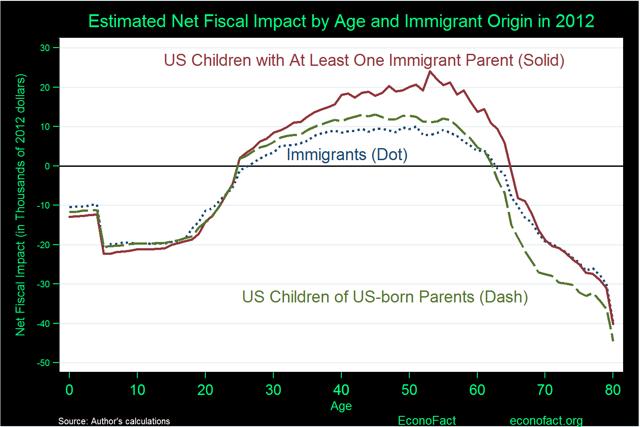
Indeed, there is a life-cycle pattern to the fiscal contribution of both natives and immigrants that is age dependent (Chart 32), so immigrants actually make a positive fiscal contribution over time as they obtain better education, language skills, and employment experience.
Chart 32: Immigrant and Native Fiscal Impact Varies with Age
Borjas estimates that the annual fiscal cost of immigration due to the federal and state services immigrants use and the lower taxes they pay (based on lower income) amounts to about $50 billion per year; note however that this is offset by the long term (lifetime or generational) fiscal surplus of $50 billion which immigrants produce to the benefit of natives due to their effect on the wealth of employers (George J. Borjas, 2016; Op. cit.)…
In conclusion it is fair to say that:
- …in the short run, illegal immigrants (who are mainly poor) and other poor immigrants are a burden on the welfare and healthcare systems for decades after their arrival;
- the native-born middle and upper classes pay the taxes to cover these costs;
- those natives without a high school education are directly harmed by lower wages due to the influx of cheap immigrant labor; and
- unemployment rates do not appear to be affected by immigration currently, although they may have been at times in the past…
Since there are already indications of an incipient global recession and a pending US slowdown, it would seem prudent to adopt a very defensive portfolio posture if one is an investor, as opposed to a trader. In the end, I believe that those who own long-term Treasuries and gold will make a lot of money in the next 12-36 months, and those holding stocks will writhe in pain at their enormous paper losses. Allowing for human nature, most people will sell closer to the bottom than the top…”
(*The author’s views and conclusions are unaltered and no personal comments have been included to maintain the integrity of the original article. Furthermore, the views, conclusions and any recommendations offered in this article are not to be construed as an endorsement of such by the editor.)
For the latest – and most informative – financial articles sign up (in the top right corner) for your FREE bi-weekly Market Intelligence Report newsletter (see sample here).
Scroll to very bottom of page & add your comments on this article. We want to share what you have to say!
If you enjoyed reading the above article please hit the “Like” button, and if you’d like to be notified of future articles, hit that “Follow” link.
Want your very own financial site? munKNEE.com is being GIVEN away – Check it out!A note from Lorimer Wilson, owner/editor of munKNEE.com – Your KEY to Making Money!:

“Illness necessitates that I spend less time on this unique & successful site so:
 munKNEE.com Your Key to Making Money
