The A/D-line has entered critical territory that deserves close examination and a close watch in the ensuing trading days. Here’s what the A/D -line is showing for the S&P 500 today and suggesting is quite possible for the markets tomorrow.
The above edited excerpts, and those that follow below, are from an article by Itinerant as posted on SeekingAlpha.com under the original title Will The Stock Market Correct After All? Another Indicator Looking Sickly and which can be read in its entirety HERE.
The A/D Line – An Explanation
In a robust rally, the majority of constituents of an index will contribute to gains. By counting and accumulating the number of advancing and declining stocks on a daily basis this effect can even be measured quite simply. The associated indicator is called “Advance/Decline Line”, or A/D-line.
- A broad advance of this A/D-line has the majority of stocks on an exchange participating causing it to move sharply higher. Such a broad advance is a bullish indicator signaling a “tide that lifts all boats”.
- A narrow advance with only a limited number of stocks participating will cause the A/D-line to move only slightly higher, or even sideways. Such a narrow advance indicates a mixed market that has only selected stocks benefiting.
- The same, only in inverse, is true for declines.
A divergence of market indicators and A/D-lines are often signs of imminent trend reversals and deserve attention when they occur and, in our view, the A/D-line has entered critical territory that deserves a close watch.
The A/D-line For the Past 5 Years
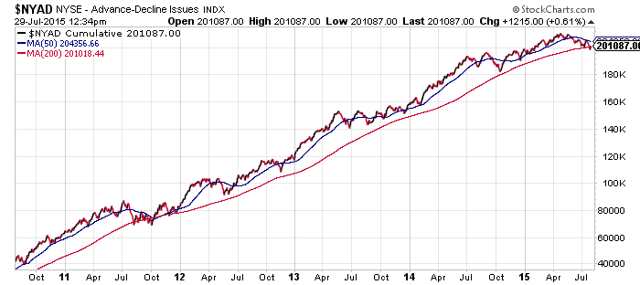
Below is a chart of the A/D-line for the past 5 years. Note that the 50 day moving average has provided support for this line in many cases and, where it failed, the 200 day moving average held strong.
The A/D Line vs. the S&P 500 Over the Past Few Months
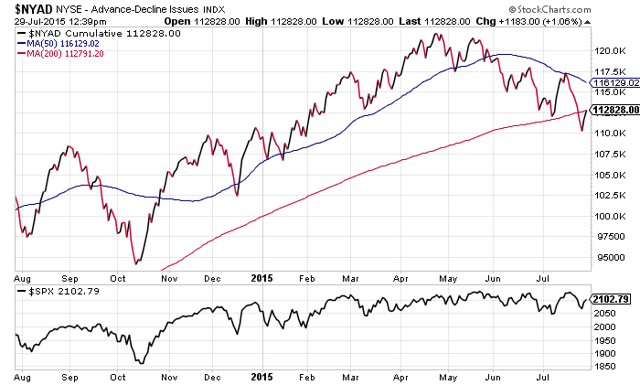
The chart below zooms in on the past few months for both the S&P 500 index and the A/D line. The actual index has been going sideways, obviously hitting resistance but neither looking weak nor strong. The A/D line on the other hand has started to look quite sickly indeed and is showing all the signs of being ready to roll over.
…From a technical point of view we note that only a couple of days ago the A/D-line has dropped below the 200 day moving average line after a series of lower highs and lower lows. A weekly and a monthly close below the 200 MDA line is threatening which would add to chart damage in progress. Furthermore, the 50 and 200 day moving average lines have come close, and a crossing of the two lines would be yet another bearish signal.
*http://seekingalpha.com/article/3382945-will-the-stock-market-correct-after-all-another-indicator-looking-sickly?ifp=0
Related Articles from the munKNEE.com Vault:
1. September To Bring Stock Market Crash & Beginning Of Economic Depression
We are now on HIGH ALERT!!!!! Grand Supercycle degree wave (IV)’s decline could start soon. We need to pay close attention and be prepared for a September 2015 event that triggers a stock market crash and economic depression.
2. Is the Stock Market Due For A MAJOR Correction – Even A Crash? These Analysts Think So
For months numerous articles have been posted on this site substantiating why a stock market collapse of epic proportions is in the cards to happen soon. The basis for such a conclusion are based on a diverse perspective that warrants your attention. With your money on the line – your future quality of life at risk – here is your opportunity to be forewarned and do something about it.
3. Stock Market Investors Should Heed These 10 Warning Signs
The warning signs are not all flashing red just yet but investors would do well to head these 10 signs that suggest that the markets may drop further and prepare their portfolio before the crowd flocks to the exit.
4. Buy, Hold or Sell? Time the Market By Watching Change In Market Trends! Here’s How
The trend is your friend and this article reviews the 7 most popular trend indicators to help you make an extensive and in-depth assessment of whether you should be buying or selling. If ever there was a “cut and save” investment advisory this article is it.
5. Go With the Flow! Time the Market By Using These 6 Momentum Indicators
Yes, you can time the market! Assessing the relative levels of greed and fear in the market at any given point in time is an effective way of doing so and this article outlines the 6 most popular momentum indicators and explains how, why and where they should be used.
6. You CAN Time the Market If You Know How! Here’s How
Much has been written that it is impossible to time the market – that a buy and hold approach is much more rewarding – but that is simply not the case. This article provides you with the knowledge and a great charting service (free) to do just that.All you need do then is set aside the time and make the effort to apply the disciplines learned.
 munKNEE.com Your Key to Making Money

