Predictions are in the air – on these pages and everywhere else – so I may as well add my own two- cents to the massive opinion-drenched internet.
The comments above and below are excerpts from an article by Gary Alexander (Navellier.com– All rights reserved) which has been edited ([ ]) and abridged (…) to provide a fast & easy read.
Prediction #1: A 12% to 16% Gain in the S&P 500 in 2017
My first “contrarian” pick makes me more bullish than the 15 most famous Wall Street analytical firms:
In “How Will Stocks Make Out in 2017?” (USA Today, December 27, 2016), Adam Shell examined the 2017 S&P 500 forecasts from 15 major Wall Street firms. All 15 see a positive 2017, but most of them see only modest gains, averaging 5.5%. On the low end, five of the 15 analysts see an S&P 500 year-end reading of 2,300, only 2.7% above the 2016 year-ending benchmark of 2,239. Only one analyst (Jonathan Golub, chief equity strategist at RBC Capital Markets) sees a double-digit 2017 S&P gain, at +11.67%.
I see the S&P climbing 12% to 16% in 2017, closing at 2,500 to 2,600, based on an expected 15% to 20% gain in underlying S&P 500 earnings. This prediction, in turn, is contingent on Congress passing a significantly lower corporate tax rate, along with a few other pro-growth measures, which should promote GDP growth of around 3% in 2017 and 2018.
Prediction #2: No First-Term (2017-2020) Recession Under Trump
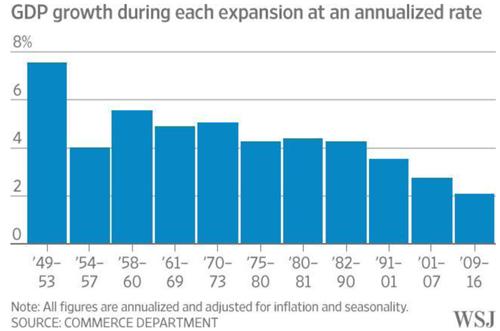
It’s fairly easy to predict no recession in 2017, due to “hope and change” after the election of a new President, [but]…it has been almost eight years since the current economic recovery began, and no growth cycle in U.S. history has stretched beyond 10 years…[but] I think this recovery will last beyond 10 years (i.e., to 2019 or later)…[because the] 2009-2016 growth rates have been so slow. A “Goldilocks” recovery (“neither too hot nor too cold”) can last longer than an overheated one. Historically, U.S. recoveries end with over-heated growth leading to over-investment. We haven’t seen that happen. Even though the unemployment rate is now below 5%, too many have left the labor force for this 5% reading to be designated “full employment.” The current recovery averages barely 2% growth vs. 4.1% in the 1980s recovery and 3.5% per year in the 10-year 1990s recovery.

Look at these recoveries in terms of aggregate percentage growth:
- 8 years of 4.1% real growth (1982-90) delivered a total accumulated growth of 38%,
- while 10 years of 3.5% annual growth (1991-2001) delivered 41% growth,
- but 8 years of 2.1% growth (2009-16) will total only 18% aggregate growth.
We have a long way to go if we went to see 40% aggregate growth during the current recovery. In fact, the slow growth we’ve seen lately reduces the chances of an inflated market bubble or a deep recession.
Ends of cycles are usually characterized by inflation and rising interest rates. Although both have risen incrementally lately, inflation and interest rates are currently well below historical norms. The world is more concerned with deflation than inflation now and, if inflation should return, the Federal Reserve has a new tool -$2.5 trillion sitting on the Fed’s balance sheet. Reducing the Fed’s balance sheet by selling government securities would be one immediate way of reducing inflation risks in the financial system.
Despite Donald Trump’s promise of 4% or greater growth in 2017, economists are now estimating that fourth-quarter 2016 GDP will grow at a much slower annual rate of 2.4%, with 2017 predictions of more of the same. A moderately rising economy in 2017 implies a continued recovery, perhaps into the 2020s.
Prediction #3: Gold Will Stay Above $1,000 Throughout 2017
I’m about to go out on a limb, and risk $1,000 in doing so. Ivan Martchev’s 2017 prediction (published here on December 13th) was that gold will fall below $1,000 per ounce in 2017. This has become a very popular prediction on the Web, republished on many sites. I’m taking a contrarian position by betting Ivan $1,000 that gold will stay above $1,000 on every London pm fix in 2017. The first day gold closes below $1,000, I will send Ivan a $1,000 check and urge him to use it to buy one ultra-cheap ounce of gold, but if gold stays above $1,000 all year, he promises to write me a $1,000 check on January 1, 2018.
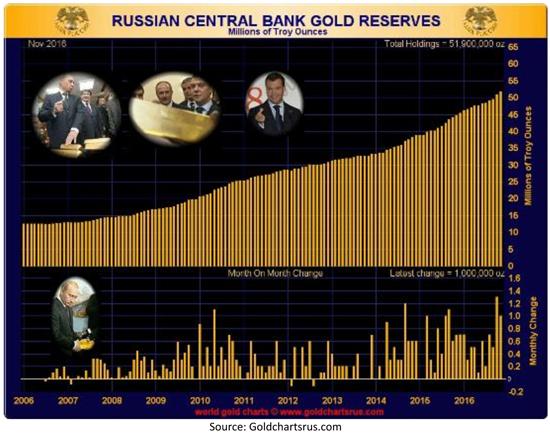
Why would I risk that much money on an inert (but admittedly pretty) metal? For one thing, I expect Russia and China to keep buying central bank gold. In October 2016, Russia bought 40.4 metric tons of gold, its largest monthly purchase since 1998, and in November, Russia bought 31.1 more metric tons. Russia has quadrupled its gold horde since 2006 (see the chart, below). China has tripled its central bank gold in the same decade. Global central bank gold purchases topped 500 tons per year in 2014 and 2015.

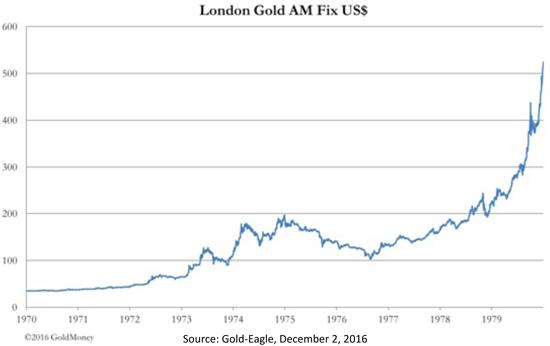
…As Ivan pointed out two weeks ago, gold can correct nearly 50% and still be in a bull market. I’m betting that gold will stop short of correcting 50%, as it did in the 1970s, when gold peaked at $195 on December 30, 1974 (based on the London pm fix that day). In the following 21 months, gold fell 47%, reaching a London pm price fix low of $103.50 on September 25, 1976. Back then, $200 gold seemed like a price ceiling, while the fear of falling below $100 created a psychological “floor” for gold in the late 1970s.

…Gold peaked at around $1,920 in September 2011 and it has since fallen as low as $1,049 in late 2015. I think $1,000 will be a psychological “floor” for gold – as $100 was in 1976. Buyers in India, China and the rest of the world tend to be very price-sensitive and will buy more gold if its price approaches $1,000.
Gold is also a proven crisis hedge when foreign conflicts erupt, as is likely to happen in early 2017, so I’m betting Ivan $1,000 that gold will stay above $1,000 in 2017. Then, next year, we can bet on my prediction #2 – on whether or not the U.S. can run longer than 10 years without falling into a recession.
 munKNEE.com Your Key to Making Money