Economics will dictate that you can only build so much storage to avert a price drop from continual over-supply and, right now, the world produces more Oil than it consumes each day, and it has for the past 16 months. This trend will only get worse so expect prices to finally start to address this over-supply issue in the Oil markets in 2013. [Let me explain further.] Words: 1640
So say edited excerpts from an article* posted on EconoMatters (www.EconoMatters.com) originally entitled WTI Crude Oil To Test $65 Level In 2013.
Lorimer Wilson, editor of www.munKNEE.com (Your Key to Making Money!), may have edited the article below to some degree for length and clarity – see Editor’s Note at the bottom of the page for details. This paragraph must be included in any article re-posting to avoid copyright infringement.
The article goes on to say, in part:
WTI closed November just shy of $89 a barrel, on hopes of an improving economy in 2013 but it is just too early to tell how things are going to come together with the economy and [as a result of] all the ramifications of basically an anti-business and social agenda political leadership of the last four years.
The Current U.S. Economic Situation
I am not making a political statement that there aren’t going to be some benefits from such governmental policies. [Rather, I am]… stating the fact that with a lot of the legislative and fiscal policies of the last four years we have yet to fully understand some of the costs and unintended consequences of these policies, such as:
- higher taxes,
- increased healthcare costs, and
- increased business regulation costs.
Just last year many analysts were expecting an increased chance of a recession in 2013 – we shall see – but even with the best case scenario for a stronger 2013 economy in the U.S. this isn’t going to effectively change the actual demand picture to any significant degree for Petroleum products in a mature market like the U.S..
The Current Europe Economic Situation
In addition, with the latest employment numbers coming out of Europe and the slowdown finally hitting Germany, it appears Europe is not going to have a robust 2013.
The Current China Economic Situation
Asia– namely China– appears to be coming off the bottom, but the days of 12% economic growth are over for the emerging market, in short, they have finally “emerged”!
China has infrastructure and inflation constraints that hamper growth levels higher than 7% going forward, and real growth may be much less than reported. This economic reality is priced into the Chinese stock market, which has had an abysmal year.
The Current Japan Economic Situation
In regard to Japan, they are about to have another leadership change– the 7th one in as many years– and this economy is in a state of perpetual deflationary decline which has lasted for the last twenty years. So, despite the new leadership change, Japan has major demographic and anti-competitive businesses constraints that augur more of the same for 2013.
The Outlook for the U.S. – Oil Demand
The U.S. market, which is a mature market, may actually have the best economy of the major economies and users of Petroleum products in 2013, and that’s not saying much from the demand side of the equation.
 |
| Source: EIA |
The Outlook for the U.S. – Oil Supply
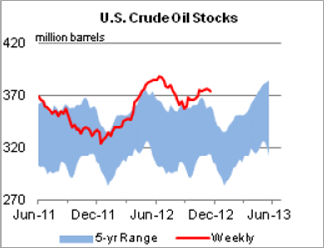
Now we get to the supply side of the equation. Here is the problem for Oil bulls, and partly the reason so many funds got killed in 2012 [see chart above] trying to aggressively invest in Oil through Futures, ETFs and the like.
- No established trends could take hold because the supply levels globally and domestically are well above the five-year average, and at the height of that range so we have had a drop in WTI from $109 to $78 totaling $31 a barrel…which is not good if you’re a fund manager investing long-term.
The most noteworthy trend in the Oil markets for 2012 is:
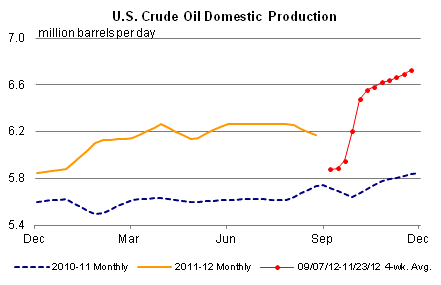
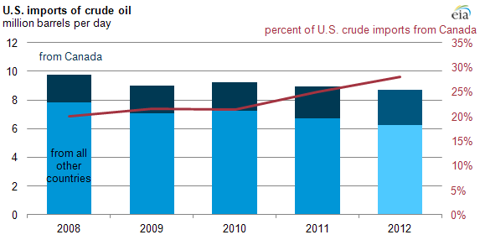
- the increased role of U.S. and Canadian production [see chart below], and it is only going to get stronger for 2013 and into the future.
The trend is definitely not a fluke; we have had a nice run of over a decade of high prices which has spurred a lot of economic investment into new technologies and an increase in smaller, independent operators searching for opportunities to make money by producing oil in North America.
 |
| Source: EIA |
We are finally starting to see the results of the increased capital investments, and just like Shale Natural Gas, these projects– once they get going– stay online, even as prices drop substantially. Expect the same for Oil, as frankly, there just aren’t a lot of areas where you can make the kind of margins that are attainable in the Oil market. It is a good business to be in versus many other industries vying for capital resources.
(click to enlarge) |
| Source: EIA |
Just to give the reader an idea of some of this dynamic change in U.S. production numbers alone, the United States is on track for a 7% increase in oil production this year to an average of 10.9 million barrels per day. Furthermore, The U.S. Department of Energy is forecasting that U.S. production of crude and other liquid hydrocarbons will average 11.4 million barrels per day in 2013. For the sake of comparison, Saudi Arabia’s output is approximately 11.6 million barrels per day.
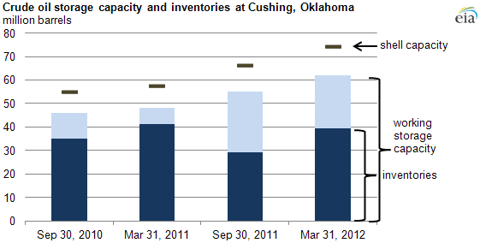
The only reason Oil isn’t much lower currently is that there has been a lot of increased Oil storage for newly built capacity in China and the U.S.. For example, Cushing Oklahoma, which is the location that the WTI Futures contract is based upon, had a storage capacity [see chart below] of approximately 47 million barrels in March 2011. With increased capacity upgrades it stands just above 60 million barrels as of March of 2012.
(click to enlarge) |
| Source: EIA |
Here is the kicker, though. On September 30, 2011 Cushing had just under 30 million barrels in storage, as of last week Cushing has 46 million barrels stored at this location, this is an increase of 16 million barrels in one year. If we have a repeat in 2013, which all signs point to as the trend is getting stronger not weaker, then Cushing will be running out of working storage capacity of just over 60 million barrels. I am sure Cushing is building more workable storage capacity as we speak, but at some level what is the point, 2013 is when WTI starts really pricing in some of this supply glut that comes from increased U.S. and Canadian production.
The supply glut just isn’t in WTI– it is felt in total U.S. inventory levels, which to quote directly from the EIA Report: “At 374.1 million barrels, U.S. crude oil inventories are well above the upper limit of the average range for this time of year.” The US inventory level will probably bust through the 400 million level in 2013 for the first time in history.
(click to enlarge) |
| Source: EIA |
Prices have also been supported by international cases of many supply disruptions during the past two years, but slowly but surely, this oil is coming back online, and I expect more output internationally.
- Libyan oil is now up to full speed,
- Iraq output had been greater than expected, and is the real wildcard because they are just now starting to hit their stride. They have the potential for much more on the upside if all those new projects start producing, not only for 2013– but for the next decade plus, it all depends upon political stability in the country.
Here is the thing you have to remember about international Oil, [however, and that is that] everybody needs money. Regardless [of whether] you are extremist, Islamic fundamentalist or Democratic, the need for money still applies, and whomever is in charge is going to need to monetize their resources. These countries have very little competitive options other than oil for generating revenue so, one way or another, this Oil finds its way to the market.
Sign up HERE to receive munKNEE.com’s unique newsletter, Your Daily Intelligence Report
- It’s FREE
- It contains the “best of the best” financial, economic and investment articles to be found on the internet
- It’s presented in an “edited excerpts” format to provide brevity & clarity of content to ensure a fast & easy read
- Don’t waste time searching for articles worth reading. We do it for you and bring them to you each day!
- Sign up HERE and begin receiving your newsletter starting tomorrow
As it happens, many of the international countries robust in Oil resources need to generate Oil revenues because a large portion of their respective populations is subsidized through Oil exports, this trend will continue as it has for the last 30 years with no major supply disruptions.
In fact, I expect OPEC will need to start entertaining supply cutbacks in 2013 to address swelling inventory levels globally. The irony here is that they may talk up the market with production cuts but the fact remains that the incentive is even greater for cheating on quotas the lower the price goes because the governments still have budgets based upon the same level of revenue, and the only way to get the same revenue with lower prices is to pump more oil.
Moreover, since a lot more capacity is capable of coming online in 2013 globally, and all these governments from Iraq to Sudan need money, expect greater achievement towards capacity which is bearish for Brent Oil prices as well, i.e., expect Brent to test the $85 level sometime in 2013.
The last decade has been exemplified by higher energy prices, and with this came increased CAPEX investment, new technologies were refined, and North America has seen a rebirth in energy activity. It all started with natural gas, and now we are starting to experience this sea of change in the Oil market. Prices in 2012 started addressing this dynamic change, but the real effects of this trend will start taking shape in 2013 as storage constraints start kicking in, demanding a re-pricing of the commodity. After all, no matter how much the Fed devalues the dollar, unlike Gold or Silver, you can only store so much Crude Oil, and with 700 million in the Strategic Reserves, another 400 million in U.S. Reserves, how much do we really need to store in an increasingly energy independent North American Region?
[As was said in the introductory paragraph to this article,] economics will dictate that you can only build so much storage to avert the price drop from continual over supply, and right now the world produces more Oil than it consumes each day, and it has for the past 16 months. This trend will only get worse in 2013 so expect prices to finally start to address this over supply issue in the Oil markets in 2013.
*http://www.econmatters.com/2012/12/wti-crude-oil-to-test-65-level-in-2013.html#more
Editor’s Note: The above post may have been edited ([ ]), abridged (…), and reformatted (including the title, some sub-titles and bold/italics emphases) for the sake of clarity and brevity to ensure a fast and easy read. The article’s views and conclusions are unaltered and no personal comments have been included to maintain the integrity of the original article.
Related Articles:
1. Brent vs. West Texas Intermediate Crude Oil: What’s the Diff?
We use crude oil for everything from running our cars to making plastic. The need for oil causes conflicts and gives power to those countries that have an abundance of it. Taking all this into account, not too many of us actually know how it’s priced. A lot of us hear how much it costs per barrel or get mad when prices go up at the pump but what’s the method behind the madness? Hopefully, I can shed a little light on the process. Words: 790
2. Canada’s Top Commodity Exports/Imports & How to Invest Accordingly
Canada has the 7th largest economy in the world and is the 2nd largest country by land mass. It has a wealth of natural resources, making it a large energy and minerals exporter. For commodity traders looking to invest primarily in North America, Canada presents a compelling opportunity. [This article takes a look at Canada’s top commodity exports and imports and offers suggestions as how to invest in Canada’s commodity industry.] Words: 905
3. Canadian Oil Sands: World’s Single Largest Petroleum Resource and…
The Canadian oil sands are the world’s single largest petroleum resource at 1.7 trillion barrels. With conventional oil supply decreasing, heavy oil projects such as the oil sands become more attractive economically to meet the needs of growing demand. While environmental concerns about the oil sands remain, the options for plentiful, cost efficient, and clean oil sources are limited.
4. These 10 Charts Should Put Your Mind at Ease Regarding Canada’s Oil Sands
The following charts come straight from the Canadian Association of Petroleum Producers in an attempt to put the benefits and impact of Alberta, Canada’s oil sands into proper perspective from their point of view. Take a look and I think you will be favourably impressed. Words: 540
5. Canada’s Oil Sands to Have $520 Billion Impact on U.S. Economy: Here Are the Facts, State by State
Canada is the largest supplier of oil to the U.S. When the U.S. imports oil from Canada, the spin-off economic benefits are substantial. The interactive map of the U.S. below will let you calculate the economic impact generated in each U.S. state from new oil sands projects in Alberta, Canada. Words: 592
6. A Look at the Canadian Oil Sands: the U.S.’s #1 Source of Supply
The third largest source of oil in the world is the Canadian oil sands and the United States already imports more of it from there than from anywhere else. With oil prices on the rise, the controversial oil sands are likely to become even more economically viable, despite experts’ warnings about environmental risks [and the political and environmental gamesmanship to block the Keystone pipeline project from there to refining facilities in the U.S.]. Below are 12 incredible facts about the oil sands. Words: 408
7. The Oil Sands are NOT the “Tar” Sands and 9 More Interesting Facts
The oil sands in northern Alberta are crucially important to the Canadian economy. People from all over the country are traveling there to find work. The news is filled with controversy over proposed pipelines (the Keystone XL and the Northern Gateway) to carry the oil to export markets. Here are 10 things everyone should know about the oil sands. Words: 878
8. Is the Abundance of Natural Gas the Answer to America’s Energy Needs?
The shale revolution has come as a surprise to many, but natural gas is now so plentiful and cheap that it could be an energy game changer. This infographic explores natural gas, its properties, natural gas market dynamics, supply forecasts, demand, the shale revolution, and the switch from coal to natural gas.
Natural gas is increasingly becoming an important fuel in meeting the global energy needs. Let’s take a quick look at the largest natural gas fields in the world. Words: 300
10. Shale Gas Info: What is Shale? What is Fracking? What Does Its Future Mean For America?
Natural gas has the potential to bridge the gap between the current oil dominated energy mix and sustainable renewables. It’s cheap, abundant, and the cleanest fossil fuel in the world. In fact, at today’s consumption rates, estimated US natural gas resources could be used to supply domestic electricity generation for 52 years.That being said, shale gas is trapped thousands of feet underground. How do we extract it and what does the process look like? The infographic below has all the details.
11. Fracking: Everything You’ve Always Wanted to Know but Were Embarrassed to Ask
Marathon Oil has a great animation on the basics of hydraulic fracturing or “fracking.” It explains how horizontal drilling works and explains the roles of water and sand. Take a look.
12. Here’s the Complete Picture Regarding Natural Gas
New gas technology such as hydraulic fracturing (fracking) and horizontal drilling have changed the complexion of natural gas in North America. This infographic explores natural gas, its properties, natural gas market dynamics, supply forecasts, demand, the shale revolution, and the switch from coal to natural gas. We also raise questions about methane leakage and hydraulic fracturing.
13. Crude Oil Supply, Demand and Price Projections are Flawed – Here’s Why
When it comes to the future of oil, there is much speculation, but little hard analysis. You have the official line from the IEA that has oil prices stopping their abrupt rise and creeping up at a comfortable pace for the next 25 years. You have peak oilers shouting that we’ve run out of oil and the end is near. [Let’s take an indepth] look at the various models and forecasts [and determine] what is logical, what is wild speculation, and what you should expect for oil prices in the coming years. Words: 1410
It wasn’t supposed to be this way. By now, Peak Oil was supposed to be a fact of daily life. People were supposed to be lined up at gas stations, struggling to buy US$10-a-gallon gas. Solar and wind companies were supposed to occupy prominent places on the Big Board instead of going out of business right and left. People were supposed to have diminished expectations – resigned to shivering in the dark. Free markets, a flawed system of commerce, were to be exposed as a misleading theoretical construct, incapable of providing for people’s needs…The world was running out of resources…Now, suddenly, there is a different tale to tell and the New York Times is up to the task. Up and down the Americas, we learn, there is an Oil Boom. Suddenly, we have gone from enforced austerity to an unheralded plenty. Middle East, watch out! [But all is not as it seems. Let me explain.] Words: 1440
15. Peak Oil Is Still With Us – Here’s Why
In a recent article called There Will Be Oil in the WSJ, Daniel Yergin once again attempts to debunk the concept of peak oil and sees global production capacity growing to 110 mmbpd by 2030, followed by slow decline. In this short report I take a quick look at his key arguments in an effort to bring further convergence between the peak oil and business-as-usual camps. [Unfortunately, I failed to do so concluding that Peak Oil is still very much with us. Let me explain.] Words: 2032
 munKNEE.com Your Key to Making Money


