A look at the chart for SLV from September 2007 to August 2008 (11 months) and from November 2010 to October 2011 (11 months) is remarkably similar – almost identical in fact. Therefore, if silver continues to trace out a similar path to what transpired in 2008, what are the possible implications for stocks, bonds, currencies, commodities, and precious metals? Take a look at the following 19 charts for some possible outcomes. Words: 731
So says Chris Ciovacco (www.ciovaccocapital.com) in an article* which Lorimer Wilson, editor of www.munKNEE.com (Your Key to Making Money!), has further edited ([ ]), abridged (…) and reformatted below for the sake of clarity and brevity to ensure a fast and easy read. The author’s views and conclusions are unaltered and no personal comments have been included to maintain the integrity of the original article. Please note that this paragraph must be included in any article re-posting to avoid copyright infringement.
Ciovacco goes on to say:
You don’t need to know anything about technical analysis to conclude the two charts below of the silver ETF (SLV) look similar in many ways. The first chart is from August 2008 and the second from 2011 (compare points A through H).
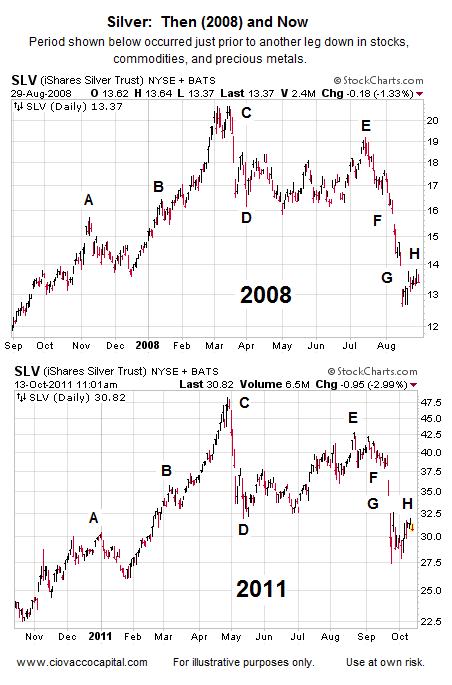
How can these charts help us with stocks, commodities, and precious metals? Silver tends to be in greater demand when (a) the economy is expected to grow, and (b) when inflation expectations are high…When silver is weak it is logical to question (a) the expectations for future economic growth, and (b) if investors are concerned about future inflation. If inflation is not a concern, then deflation fears are most likely increasing.
Who in the world is currently reading this article along with you? Click here to find out.
The charts below show asset class performance from August 29, 2008 through November 21, 2008, allowing us to answer the question, “What happened next in the 2008 deflationary period?”
The key for the charts below: (SPY) S&P 500, (EEM) emerging markets, (FXA) Australian dollar, (UUP) U.S. Dollar Index, (DIA) Dow, (DVY) dividend stocks, (TLT) Treasuries, (SH) short S&P 500, (GDX) gold stocks, (GLD) gold, (SLV) silver, (DBC) commodities, (DBA) agriculture, (EWG) Germany, (PFF) preferred stocks, (XLU) utilities, (XLP) consumer staples, (XLY) consumer descretionary, and (JJC) copper. Symbols and descriptions are shown in the upper-left corner of each chart below.
What happened next in 2008?
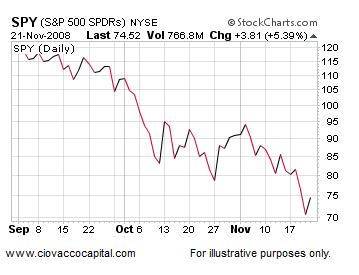
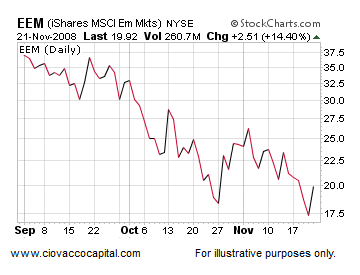
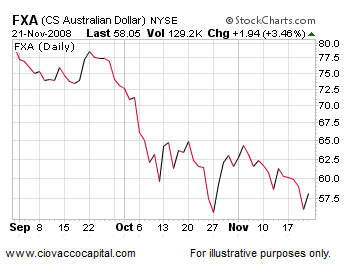
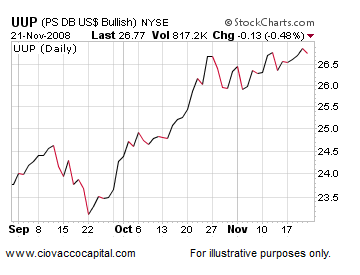
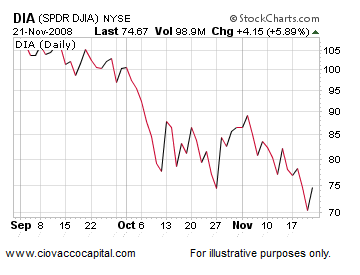
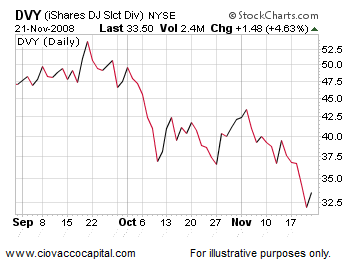
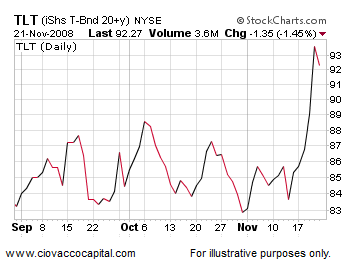
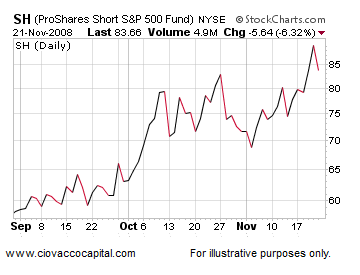
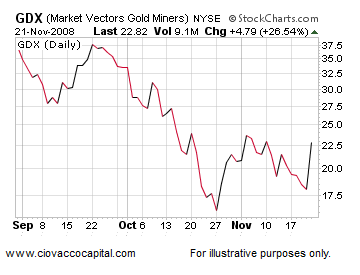
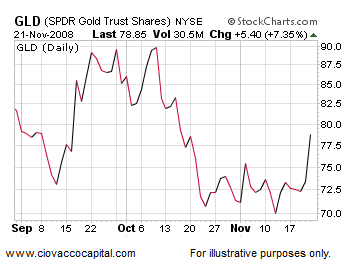
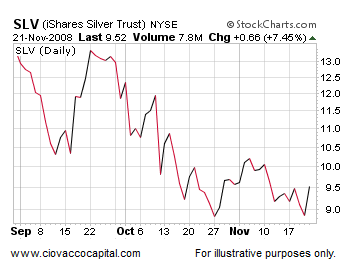
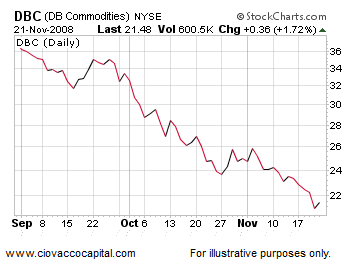
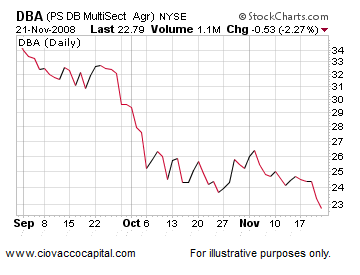
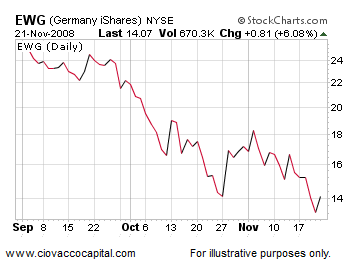
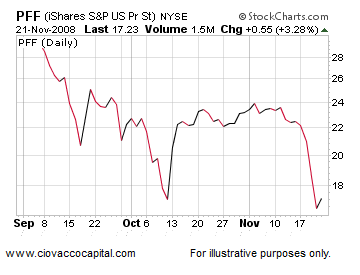
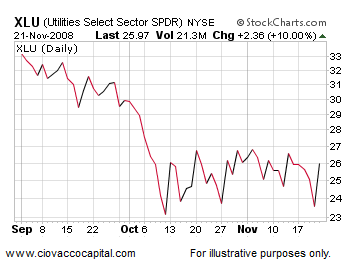
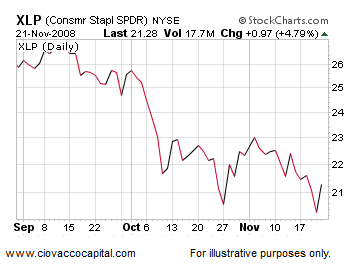
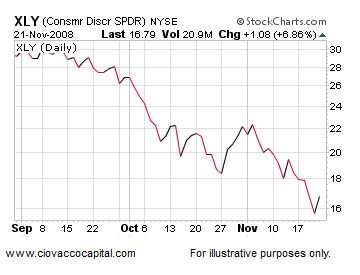
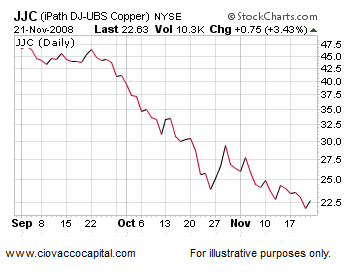
If the silver ETF can fill the gap…between 32.54 and 34.51, it increases the odds of bullish outcomes for stocks and commodities. The longer SLV can hold above 32.54 the better for the bulls. If SLV fails to clear 32.54, the odds increase of an August 2008 scenario occurring again, similar to the outcomes shown in the charts above. An intraday move in SLV below 27.41, and more importantly, a weekly close below 27.41, increases the odds the deflationary trio of shorts (SH), the dollar (UUP), and bonds (TLT) will perform well.
Conclusion
As of this writing, we continue to give the bearish/deflationary case the benefit of the doubt, understanding strong and gut-wrenching countertrend rallies are part of any bear market. Our portfolios continue to contain a mix of cash, shorts (SH), bonds (TLT), and the dollar (UUP). The deflationary/bearish case will take a hit if the S&P 500 trades between 1,250 and 1,260 for more than three or four days.
*http://www.safehaven.com/article/22924/silvers-signals-lean-bearish-for-stocks-and-commodities
 munKNEE.com Your Key to Making Money
ETFs are just as worthless as FIAT money. When the system collapses the FIAT money will be toilet paper and the companies that sold you shares (ETFs) will either not return your phonecalls when you decide to take possession of it or they will be non-existent (doors closed-windows boarded up) businesess that left you with empty promises. If you are smart you will only buy Gold and Silver that you can have physical possession of.