Given that the financial system is now even more leveraged than it was during the tech bubble… and that we’ve added TRILLIONS in debt to the U.S.’s balance sheet…another systemic collapse [was to be expected and, in fact, was predicted by]… a stock market pattern that has occurred multiple times in the last century – and everytime it did, things got UGLY [- just like it is doing this time. Let’s take a look.] Words: 422
So says Graham Summers (www.gainspainscapital.com) in edited excerpts from an article* which Lorimer Wilson, editor of www.munKNEE.com (It’s all about Money!), has further edited ([ ]), abridged (…) and reformatted below for the sake of clarity and brevity to ensure a fast and easy read. Please note that this paragraph must be included in any article re-posting to avoid copyright infringement. Summers goes on to say:
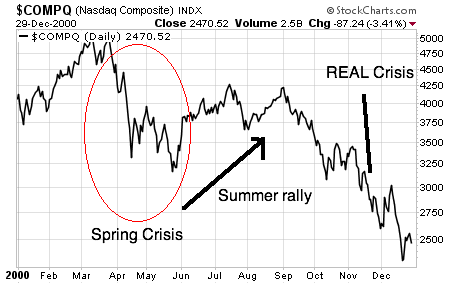
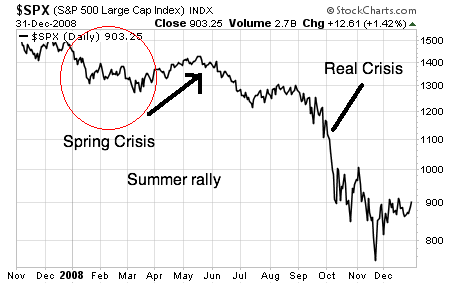
The pattern [I am referring to] occurred in 1907, 1929, 1931, 1987, 2000 and 2008 [and,] in each of those years, stocks came undone [as the result of] some kind of crisis during the March –May period [followed by] a brief summer “relief” rally, and then things got VERY ugly in the fall.
[Editor’s note: Summers wrote the original version of this article on July 27th prior to the initial crash on Thursday, July 28th as can be verified by the date on the third chart below.]Here’s the pattern for 2000:
Here it is in 2008:
The market…traded sideways for most of 2011 – but then the pattern emerged [and then developed as predicted]:
Given that the financial system is now even more leveraged than it was during the tech bubble… and that we’ve added TRILLIONS in debt to the U.S.’s balance sheet…another systemic collapse [was to be expected].
*http://gainspainscapital.com/?option=com_content&view=article&id=107:will-gold-miners-act-like-stocks-or-gold-during-the-crash&catid=42:commodities&Itemid=73
Related Articles:
- Market Crash Will Hit By Christmas 2011! Here’s Why https://munknee.com/2011/07/the-sp-500-is-worth-only-910-get-out-or-lose-big/
- S&P 500 Likely To Top Out at 1400 – 1500 & Then Topple to 400! Here’s Why https://munknee.com/2011/02/uncanny-relationship-with-nikkei-1929-crash-suggests-sp-500-about-to-top-out-and-then-tumble/
- Stock Market is Due for a 15-20% Correction – Here’s Why https://munknee.com/2011/06/stock-market-is-due-for-a-15-20-correction-heres-why/
- A Violent Correction Is Coming For the S&P 500! Here’s Why https://munknee.com/2011/06/a-violent-correction-is-coming-for-the-sp-500-heres-why/
- Why a Major Stock Market Correction is Imminent https://munknee.com/2011/05/why-and-how-best-to-play-a-major-stock-market-correction-is-imminent/
- S&P 500 is 45% Overvalued According to Reversion to Mean Analysis! https://munknee.com/2011/01/these-2-historical-charts-show-how-high-then-how-low-the-sp-500-might-go/
- How Mean Will the S&P 500′s Future Regression to Trend Be? https://munknee.com/2011/01/how-mean-will-the-sp-500s-future-regression-to-trend-be/
Editor’s Note:
- The above article consists of reformatted edited excerpts from the original for the sake of brevity, clarity and to ensure a fast and easy read. The author’s views and conclusions are unaltered.
- Permission to reprint in whole or in part is gladly granted, provided full credit is given as per paragraph 2 above.
 munKNEE.com Your Key to Making Money


