Longer-Term Silver Price Forecast to Trend to $82.91
With everyone and their grandmother calling a blow-off top in Silver we thought it prudent to present an alternate perspective [which strongly suggests that we could well see $52.58 silver by mid-June of this year. Let me explain.] Words: 632
So says Joseph Russo, Chief Publisher and Technical Analyst of www.elliottwavetechnology.com, in an article* which Lorimer Wilson, editor of www.munKNEE.com, has reformatted and edited […] below for the sake of clarity and brevity to ensure a fast and easy read. (Please note that this paragraph must be included in any article re-posting to avoid copyright infringement.) Russo goes on to say:
Long-term Silver Chart
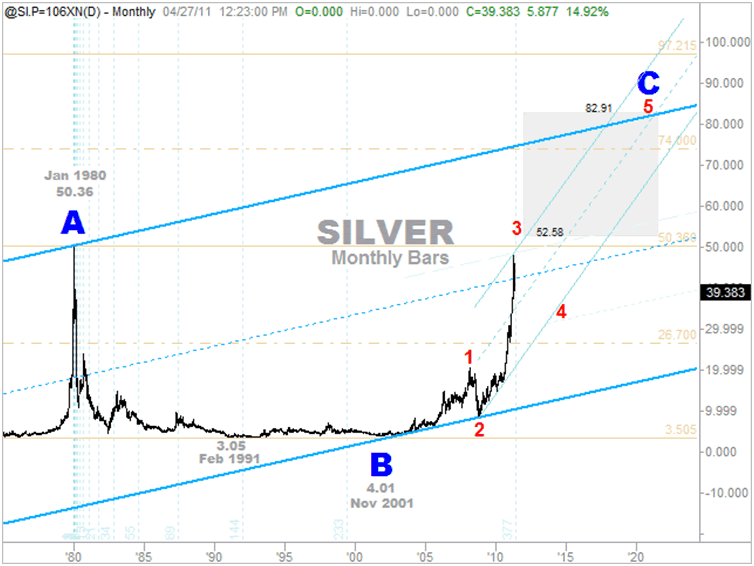
Below is a continuation chart of Silver dating back prior to the Hunt Brother top at $50.36 in January of 1980. Though at first glance the parabolic rise into the 1980 high looks similar to our current advance in 2011, they are by no means the same. The big bang from 1975-1980 was “J” shaped meaning that there was at first a slow unassuming rise and then a more abrupt and persistent short-lived [5 months] parabolic explosion [which occurred] from $10.70 in September of 1979 to the $50.36 print high in January of 1980 [representing an increase of 370.65%].

Intermediate-term Silver Chart
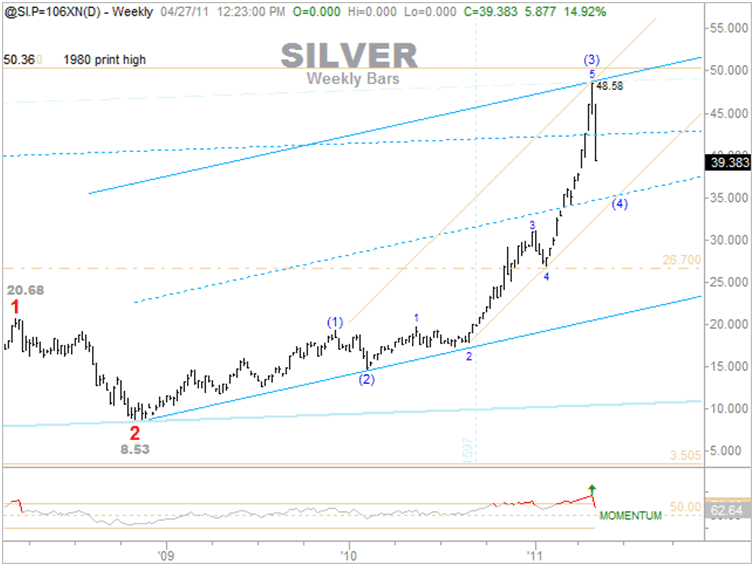
Below is the weekly continuation chart of Silver from its most recent $8.53 print low in 2008. Consolidating to the tune of 58% from its journey north of $20 in March of 2008, Silver resumed an otherwise orderly advance in October of that same year.

Silver’s Upside Targets are $52.58 and $82.91
As noted in the long-term monthly chart that began this article, Silver has at least two remaining upside targets that are quite viable going forward. In our contrary technical assessment, Silver maintains an upside price target window that opens at $52.58 [per ozt.], and closes at $82.91 per ozt.. The general timeframe for that window spans from June 2011 through 2021. [It is interesting to note that fractal analysis of silver, as deployed by Goldrunner in an article here, has determined that silver should achieve a price of $52.80 to $56 per ozt.* by mid-June, 2011 and for an explanation of the significance of the ozt. designation please read this article.]
If the above targets are to be achieved, the wave count resident in our weekly bar chart above is the count most likely to be in force. Such a count suggests that the recent print high was that of an intermediate (3) wave, and the current move down will don the eventual (4) wave label.
Given that fifth waves tend to extend in the commodity arena, and that Silver may be approaching only that of an intermediate 4th wave decline, one must not ignore the possibility that Silver’s primary 5th wave advance may jettison the poor man’s gold to $82 dollars per ounce. At that stage, a blow-off rally might then witness Silver lunge for the $100 mark and possibly fail.
Conclusion
Whatever you do, don’t bet the ranch on another 21-year bear market following Silver’s April 2011 print high just south of $50.
*http://howestreet.com/content/articles/elliott-wave-technology/
Editor’s Note:
- The above article consists of reformatted edited excerpts from the original for the sake of brevity, clarity and to ensure a fast and easy read. The author’s views and conclusions are unaltered.
- Permission to reprint in whole or in part is gladly granted, provided full credit is given as per paragraph 2 above.
- Sign up to receive every article posted via Twitter, Facebook, RSS Feed or our FREE Weekly Newsletter.
Silver
 munKNEE.com Your Key to Making Money
My charts are saying we start to go up and down side is limited from here… I’m buying this up coming week…. Whatch and see folks. This was pure manipulated correction – scare tactic – no real fundamental reason for a correction. Sell in may huh, ya nooo, not this time