Corporate Profits Suggest that Market not Overvalued
There are different ways to interpret corporate profits and different ways to measure them [and in this article I substantiate] my belief that profits are quite strong and that the market is almost certainly not overestimating their value [unlike other analysts who, in articles here and here, and using different criteria, have come to different conclusions. Please read all the various points of view and come to your own conclusions.] Words: 646
So says Scott Grannis, the Calafia Beach Pundit, (http://scottgrannis.blogspot.com/) in an article* which Lorimer Wilson, editor of www.munKNEE.com, has further edited ([ ]), abridged (…) and reformatted below for the sake of clarity and brevity to ensure a fast and easy read. (Please note that this paragraph must be included in any article re-posting to avoid copyright infringement.) Grannis goes on to say:
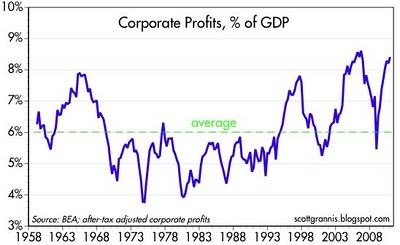
1. Corporate Profits as a % of GDP
As you can see, profits have almost never been as strong as they are today, and profits have rebounded sharply (the V-est of V-shaped recoveries) in the past few years even though the recovery has been tepid. Given how strong profits have been, and how low interest rates are, you might think that equities would be at or near all-time highs, but you would be wrong. As a reminder, the S&P 500 index today is about the same as it was 12 years ago.
Sign up for your FREE weekly “Top 100 Stock index, Asset Ratio & Economic Indicators in Review”
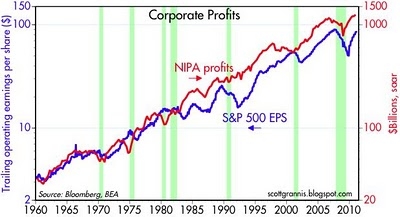
2. NIPA Corporate Profits vs. S&P 500 Company Earnings per Share
Over time, the two measures are well correlated, but I note that NIPA profits tend to lead accounting profits. NIPA profits are quarterly annualized numbers, whereas accounting profits are trailing 12-month totals, so they they have a built-in tendency to lead. Even taking that into account, NIPA profits tend to lead accounting profits, and NIPA profits are pointing to further gains for accounting profits in the year to come.
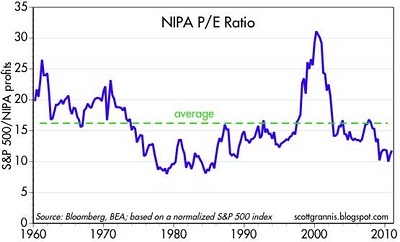
3. NIPA P/E Ratio
This third chart uses NIPA profits as a proxy for corporate earnings, and the S&P 500 index as a proxy for the value of corporate equity, to come up with a sort of economy-wide PE ratio.
Here we see that the valuation of corporate equities is substantially below its long-term average, even though profits are very near their all-time high as a percent of sales (using GDP as a proxy for sales). One easy conclusion is that equities are definitely not expensive. I note also that the standard S&P 500 PE ratio, currently 15.5, is below its long-term average of 16.5.
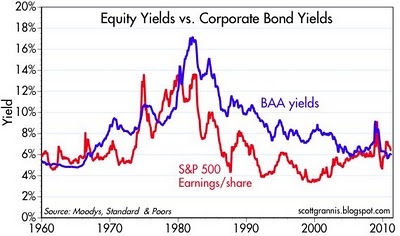
4. Equity Yields vs. Corporate Bond Yields
In a perfect world, earnings per share would be lower than bond yields, since equity owners are lower in the capital structure and bond owners get first claim to earnings; equity owners should be willing to accept a lower yield since they can benefit from higher equity prices and higher top-line growth. Instead, we see that earnings yields are higher than bond yields, a situation that has occurred fairly rarely in the past.
Conclusion
Editor’s Note:
- The above article consists of reformatted edited excerpts from the original for the sake of brevity, clarity and to ensure a fast and easy read. The author’s views and conclusions are unaltered.
- Permission to reprint in whole or in part is gladly granted, provided full credit is given as per paragraph 2 above.
- Sign up to receive every article posted via Twitter, Facebook, RSS feed or our FREE Weekly Newsletter.
Profits
 munKNEE.com Your Key to Making Money


