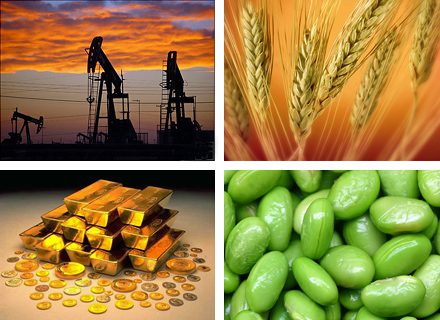
Is gold a commodity or currency? How does it behave as an investment? What are the fundamentals of investing in gold? What are the different ways investors can get exposure to gold in their portfolios? The answers to these questions and many others are answered in this latest infographic from Visual Capitalist.
So says www.visualcapitalist.com in their 4th* in a 4-part series on gold presented here by www.munKNEE.com (Your Key to Making Money!) and www.FinancialArticleSummariesToday.com (A site for sore eyes and inquisitive minds). Part 1 can be seen here, Part 2 here and Part 3 here.

*http://www.visualcapitalist.com/portfolio/the-gold-series-gold-as-an-investment-part-4
Other Infographics on Gold:
1. Part 1: An Infographic on the History of Gold and What Makes It So Great
Wars have been fought over gold, love has been expressed by it an gold has changed the landscape of civilizations and the world – but what makes gold so great? This infographic examines the history of gold from ancient history to the gold rushes of the centuries ago. It looks at its properties and how it became not only a currency, but the gold standard.
2. Part 2: An Infographic on Gold Mining & Supply
From ancient times to the famous gold rushes, gold was first discovered in placer deposits….Today, however, most gold comes from hard rock deposits where gold is disseminated or associated with other metals and mined either through open pit or underground mining. This infographic tells (shows) you everything you need to know about gold mining and its supply from around the world.
3. Part 3: China’s Role in the Future of Gold
In this infographic we look at how gold growth in China will impact the future of the precious metal. In Q4 of 2011 and continuing into 2012, China has bought more gold overall than even India and will continue to play an important role in consumption.
4. 2012 Ranking of Global Gold Mines & Deposits
How many ounces of in-situ gold exist? How many gold mines exist in Canada and elsewhere? How rare is a 1.0 million ounce undeveloped deposit? This report answers these questions and more while providing insight into the scarcity of mines & deposits.
5. Take a Look: This Interactive Infographic Shows Gold’s Ongoing Interaction With World Events
As long as there have been people, there’s been an attraction to gold. From pharaohs to hedge funds, gold has been an important tool of building and protecting wealth. Take a look at the interactive gold timeline below which carries you through gold’s enduring path as a universal symbol of wealth.
6. This Infographic on Gold Shows/Tells It All
The Gold Tree Infographic below visualizes above-ground stock, sources and uses of gold and pictures the different forms of gold investments – ranging from physical gold in the form of bullion gold to securities not backed by gold.
7. Vaulted Gold: What Is It and How Does It Compare With Other Gold Investments?
The infographic below on vaulted gold explains what vaulted gold is and visualizes key facts relating to investments in gold that is stored on behalf of investors in high-security vaults.
8. Where in the World Does All the Gold Come From? Look at This Infographic
Gold-producing countries are found on nearly all continents, and represent the gamut of economies from developed super-powers to small, emerging market countries. With gold’s spectacular rise in price and related demand, it’s worth your time to know a little bit about where all the gold comes from.
9. Are You a Gold Guru? Take This Quiz & Find Out
You know it’s shiny, it’s rare and it’s the standard against which all good things are measured but how much do you really know about gold? Take the 2.0 edition of our interactive quiz to test your knowledge of gold history, geography and politics….
10. This Interactive Table of Commodity Returns Is Easy to Use – Try It
Natural resources are the building blocks of the world, essential to progress and prosperity. These commodities, like all investments, can have wide price fluctuations over time. The interactive table provided shows the ebb and flow of commodity prices over the past decade and illustrates the principle of mean reversion—the concept that returns eventually move back towards their mean or average. [Take a look.]
 munKNEE.com Your Key to Making Money


