Back in the early 1990s and 2000s, central banks were continuously selling off gold as strong economic growth during that time rendered bullion less attractive than currencies in many places….Then the 2007–08 financial crisis came, triggering a complete 180 [degree turn] in the official banks’ approach to gold. From 2010 onwards, central banks have been net buyers on an annual basis. About 80% of central banks currently hold gold as part of their international reserves.
This article is an edited ( [ ]) and abridged (…) excerpt from an article by Richard Mills with added data and copy from BullionVault.
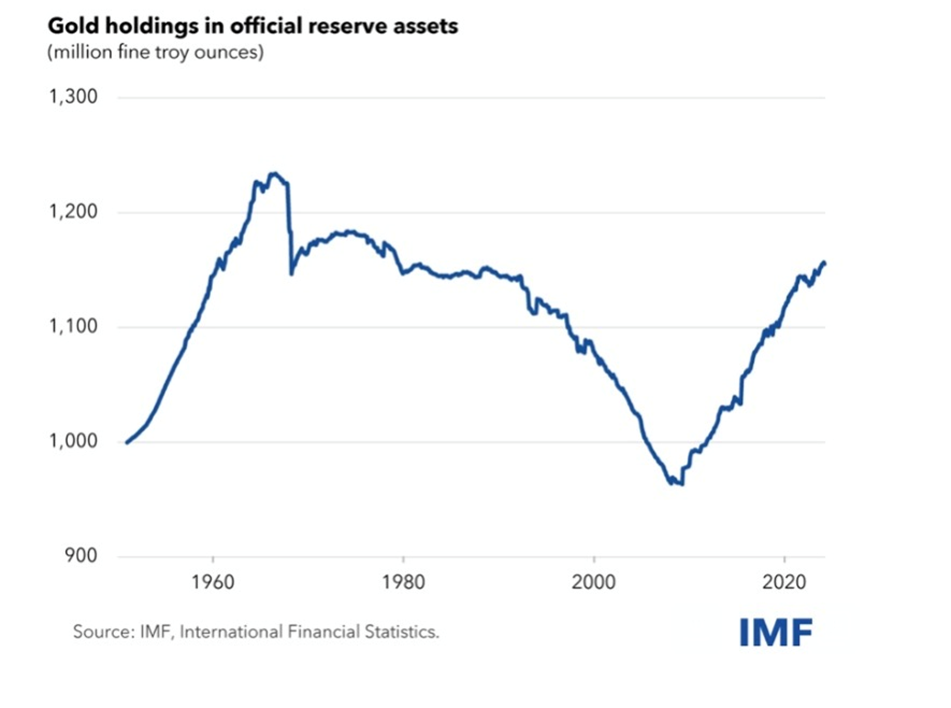
Central Bank Gold Holdings
…After decades of shedding their holdings, Central Banks are rebuilding them. According to the IMF, they’re currently at 1.16 billion troy ounces [Gold: What Do Terms “Karat” & “Troy” Mean? What’s A “Carat”?] – roughly $2.7 trillion of $12.3 trillion in foreign exchange reserves – [amounting to]…about 17 percent of all the gold ever mined, with reserves topping 36,699 metric tons (MT) as of year-end 2023. They acquired the vast majority in the last 14 years after becoming net buyers of the metal in 2010.
| Country | 20 years change (tonnes) | 10 years change (tonnes) | 5 years change (tonnes) | 3 years change (tonnes) | Summer 2024 total tonnes held | Last 3 years change as % of current holdings |
|---|---|---|---|---|---|---|
| Afghanistan | 21.9 | 0.0 | 0.0 | 0.0 | 21.9 | 0.0% |
| Albania | 1.2 | 1.8 | 1.3 | 0.6 | 3.4 | 17.6% |
| Algeria | 0.0 | 0.0 | 0.0 | 0.0 | 173.6 | 0.0% |
| Argentina | 19.1 | 0.0 | 6.8 | 0.0 | 61.7 | 0.0% |
| Armenia | 0.0 | 0.0 | 0.0 | 0.0 | 0.0 | 0.0% |
| Aruba, Kingdom of the Netherlands | 0.0 | 0.0 | 0.0 | 0.0 | 3.1 | 0.0% |
| Australia | 0.2 | 0.0 | 11.2 | 6.1 | 79.9 | 7.6% |
| Austria | -37.5 | 0.0 | 0.0 | 0.0 | 280.0 | 0.0% |
| Azerbaijan | 104.8 | 54.6 | 9.3 | 3.0 | 104.8 | 2.9% |
| Bahamas | 0.0 | 0.0 | 0.0 | 0.0 | 0.0 | 0.0% |
| Bahrain | 0.0 | 0.0 | 0.0 | 0.0 | 4.7 | 0.0% |
| Bangladesh | 10.8 | 0.8 | 0.3 | 0.3 | 14.3 | 2.1% |
| Barbados | 0.0 | 0.0 | 0.0 | 0.0 | 0.0 | 0.0% |
| Belarus | 51.0 | 12.7 | 5.5 | 4.0 | 54.1 | 7.4% |
| Belgium | -30.4 | 0.0 | 0.0 | 0.0 | 227.4 | 0.0% |
| Belize | 0.0 | 0.0 | 0.0 | 0.0 | 0.0 | 0.0% |
| Benin | 0.0 | 0.0 | 0.0 | 0.0 | 0.0 | 0.0% |
| Bhutan | 0.7 | 0.7 | 0.7 | 0.0 | 0.7 | 0.0% |
| Bolivia | -5.9 | -20.1 | -20.1 | -20.1 | 22.4 | -89.7% |
| Bosnia and Herzegovina | 1.5 | -1.5 | -1.5 | -1.5 | 1.5 | -100.0% |
| Brazil | 96.1 | 62.5 | 62.3 | 8.6 | 129.7 | 6.6% |
| Brunei | 4.5 | 0.3 | 0.0 | 0.0 | 4.5 | 0.0% |
| Bulgaria | 1.1 | 0.9 | 0.4 | 0.1 | 40.9 | 0.2% |
| Burkina Faso | 0.0 | 0.0 | 0.0 | 0.0 | 0.0 | 0.0% |
| Burundi | 0.0 | 0.0 | 0.0 | 0.0 | 0.0 | 0.0% |
| Cabo Verde | 1.0 | 1.0 | 1.0 | 0.0 | 1.0 | 0.0% |
| Cambodia | 29.9 | 29.9 | 11.8 | -8.1 | 42.3 | -19.1% |
| Cameroon | -0.9 | 0.0 | 0.0 | 0.0 | 0.0 | 0.0% |
| Canada | -3.4 | -3.0 | 0.0 | 0.0 | 0.0 | 0.0% |
| Cayman Islands | 0.0 | 0.0 | 0.0 | 0.0 | 0.0 | 0.0% |
| Central African Republic | -0.3 | 0.0 | 0.0 | 0.0 | 0.0 | 0.0% |
| Chad | -0.3 | 0.0 | 0.0 | 0.0 | 0.0 | 0.0% |
| Chile | 0.0 | 0.0 | 0.0 | 0.0 | 0.2 | 0.0% |
| China | 1,664.3 | 1,210.2 | 337.8 | 316.0 | 2,264.3 | 14.0% |
| Colombia | -5.5 | -5.7 | -14.2 | 0.0 | 4.7 | 0.0% |
| Comoros, Union of the | 0.0 | 0.0 | 0.0 | 0.0 | 0.0 | 0.0% |
| Congo, Democratic Republic | 0.0 | 0.0 | 0.0 | 0.0 | 0.0 | 0.0% |
| Congo, Republic of | -0.3 | 0.0 | 0.0 | 0.0 | 0.0 | 0.0% |
| Costa Rica | -0.1 | 0.0 | 0.0 | 0.0 | 0.0 | 0.0% |
| Croatia | 1.9 | 1.9 | 1.9 | 1.9 | 1.9 | 100.0% |
| Curaçao and Sint Maarten | 9.2 | -3.9 | -3.9 | -3.9 | 9.2 | -42.4% |
| Cyprus | -0.6 | 0.0 | 0.0 | 0.0 | 13.9 | 0.0% |
| Czech Republic | 27.9 | 30.8 | 33.3 | 31.6 | 41.5 | 76.1% |
| Denmark | 0.0 | 0.0 | 0.0 | 0.0 | 66.5 | 0.0% |
| Dominican Republic | 0.0 | 0.0 | 0.0 | 0.0 | 0.6 | 0.0% |
| Ecuador | 0.0 | 14.2 | 9.4 | -5.0 | 26.3 | -19.0% |
| Egypt | 50.9 | 51.0 | 47.8 | 46.0 | 126.6 | 36.3% |
| El Salvador | -13.2 | -5.5 | 0.0 | 0.0 | 1.4 | 0.0% |
| Equatorial Guinea | 0.0 | 0.0 | 0.0 | 0.0 | 0.0 | 0.0% |
| Eritrea | 0.0 | 0.0 | 0.0 | 0.0 | 0.0 | 0.0% |
| Estonia | 0.0 | 0.0 | 0.0 | 0.0 | 0.2 | 0.0% |
| Ethiopia | 0.0 | 0.0 | -0.2 | 0.0 | 0.0 | 0.0% |
| Fiji | 0.0 | 0.0 | 0.0 | 0.0 | 0.0 | 0.0% |
| Finland | -0.1 | -0.1 | -0.1 | -0.1 | 49.0 | -0.2% |
| France | -587.7 | 1.6 | 0.9 | 0.7 | 2,437.0 | 0.0% |
| Gabon | -0.4 | 0.0 | 0.0 | 0.0 | 0.0 | 0.0% |
| Georgia | 0.0 | 0.0 | 0.0 | 0.0 | 0.0 | 0.0% |
| Germany | -85.1 | -32.6 | -15.2 | -7.5 | 3,351.6 | -0.2% |
| Ghana | 0.0 | 0.0 | 0.0 | 0.0 | 8.7 | 0.0% |
| Greece | 7.1 | 2.2 | 1.3 | 0.5 | 114.5 | 0.4% |
| Guatemala | 0.0 | 0.0 | 0.0 | 0.0 | 6.9 | 0.0% |
| Guinea | -0.3 | -0.2 | -4.6 | 0.0 | 0.0 | 0.0% |
| Guinea-Bissau | 0.0 | 0.0 | 0.0 | 0.0 | 0.0 | 0.0% |
| Haiti | 1.8 | 0.0 | 0.0 | 0.0 | 1.8 | 0.0% |
| Honduras | 0.0 | 0.0 | 0.0 | 0.0 | 0.7 | 0.0% |
| Hong Kong | 0.0 | 0.0 | 0.0 | 0.0 | 2.1 | 0.0% |
| Hungary | 91.4 | 91.4 | 63.0 | 0.0 | 94.5 | 0.0% |
| Iceland | 0.0 | 0.0 | 0.0 | 0.0 | 2.0 | 0.0% |
| India | 473.6 | 273.6 | 213.2 | 127.7 | 831.4 | 15.4% |
| Indonesia | -17.9 | 0.5 | 0.1 | 0.0 | 78.6 | 0.0% |
| Iraq | 148.3 | 58.5 | 52.0 | 51.9 | 148.3 | 35.0% |
| Ireland | 6.5 | 6.0 | 6.0 | 6.0 | 12.0 | 50.0% |
| Israel | 0.0 | 0.0 | 0.0 | 0.0 | 0.0 | 0.0% |
| Italy | 0.0 | 0.0 | 0.0 | 0.0 | 2,451.9 | 0.0% |
| Ivory Coast | 0.0 | 0.0 | 0.0 | 0.0 | 0.0 | 0.0% |
| Jamaica | 0.0 | 0.0 | 0.0 | 0.0 | 0.0 | 0.0% |
| Japan | 80.8 | 80.8 | 80.8 | 0.0 | 846.0 | 0.0% |
| Jordan | 57.3 | 53.3 | 36.3 | 7.7 | 70.1 | 11.0% |
| Kazakhstan | 243.4 | 143.0 | -76.5 | -87.1 | 298.8 | -29.1% |
| Kenya | 0.0 | 0.0 | 0.0 | 0.0 | 0.0 | 0.0% |
| Korea | 90.3 | 0.0 | 0.0 | 0.0 | 104.4 | 0.0% |
| Kosovo | 0.0 | 0.0 | 0.0 | 0.0 | 0.0 | 0.0% |
| Kuwait | 0.0 | 0.0 | 0.0 | 0.0 | 79.0 | 0.0% |
| Kyrgyz Republic | 23.2 | 22.0 | 12.6 | 18.2 | 25.8 | 70.5% |
| Laos | -3.6 | -8.9 | -0.9 | 0.0 | 0.0 | 0.0% |
| Latvia | -1.0 | 0.1 | 0.1 | 0.0 | 6.7 | 0.0% |
| Lebanon | 0.0 | 0.0 | 0.0 | 0.0 | 286.8 | 0.0% |
| Lesotho, Kingdom of | 0.0 | 0.0 | 0.0 | 0.0 | 0.0 | 0.0% |
| Libya | 2.9 | 30.1 | 30.1 | 30.1 | 146.7 | 20.5% |
| Lithuania | 0.0 | 0.0 | 0.0 | 0.0 | 5.8 | 0.0% |
| Luxembourg | -0.1 | -0.1 | 0.0 | 0.0 | 2.2 | 0.0% |
| Malawi | -0.4 | -0.4 | 0.0 | 0.0 | 0.0 | 0.0% |
| Malaysia | 2.5 | 3.4 | 0.0 | 0.0 | 38.9 | 0.0% |
| Maldives | 0.0 | 0.0 | 0.0 | 0.0 | 0.0 | 0.0% |
| Mali | 0.0 | 0.0 | 0.0 | 0.0 | 0.0 | 0.0% |
| Malta | 0.1 | 0.0 | 0.0 | 0.0 | 0.2 | 0.0% |
| Mauritania | 0.0 | -0.4 | -1.0 | 0.0 | 0.0 | 0.0% |
| Mauritius | 10.5 | 8.5 | 0.0 | 0.0 | 12.4 | 0.0% |
| Mexico | 115.0 | -3.1 | 0.1 | 0.1 | 120.2 | 0.1% |
| Micronesia, Federated States of | 0.0 | 0.0 | 0.0 | 0.0 | 0.0 | 0.0% |
| Moldova | 0.1 | 0.0 | 0.0 | 0.0 | 0.1 | 0.0% |
| Mongolia | 1.5 | 2.2 | -14.3 | -8.5 | 4.7 | -180.9% |
| Montenegro | 0.0 | 0.0 | 0.0 | 0.0 | 0.0 | 0.0% |
| Morocco | 0.1 | 0.0 | 0.0 | 0.0 | 22.1 | 0.0% |
| Mozambique | -0.3 | -0.5 | -0.5 | 0.0 | 3.9 | 0.0% |
| Myanmar | 0.1 | 0.0 | 0.0 | 0.0 | 7.3 | 0.0% |
| Namibia | 0.0 | 0.0 | 0.0 | 0.0 | 0.0 | 0.0% |
| Nepal | 3.2 | 4.1 | 1.6 | 1.6 | 8.0 | 20.0% |
| Netherlands | -165.0 | 0.0 | 0.0 | 0.0 | 612.5 | 0.0% |
| New Zealand | 0.0 | 0.0 | 0.0 | 0.0 | 0.0 | 0.0% |
| Nicaragua | -0.5 | 0.0 | 0.0 | 0.0 | 0.0 | 0.0% |
| Niger | 0.0 | 0.0 | 0.0 | 0.0 | 0.0 | 0.0% |
| Nigeria | -21.4 | -21.4 | 0.0 | 0.0 | 0.0 | 0.0% |
| North Macedonia, Republic of | 4.1 | 0.1 | 0.0 | 0.0 | 6.9 | 0.0% |
| Norway | 0.0 | 0.0 | 0.0 | 0.0 | 0.0 | 0.0% |
| Oman | 6.7 | 6.7 | 6.7 | 6.7 | 6.7 | 100.0% |
| Pakistan | -0.6 | 0.3 | 0.1 | 0.1 | 64.7 | 0.2% |
| Papua New Guinea | -0.7 | -0.7 | 0.0 | 0.0 | 1.3 | 0.0% |
| Paraguay | 7.1 | 0.0 | 0.0 | 0.0 | 8.2 | 0.0% |
| Peru | 0.0 | 0.0 | 0.0 | 0.0 | 34.7 | 0.0% |
| Philippines | -116.0 | -60.3 | -63.8 | -22.0 | 134.1 | -16.4% |
| Poland | 274.5 | 274.5 | 149.2 | 145.6 | 377.4 | 38.6% |
| Portugal | -99.6 | 0.2 | 0.2 | 0.1 | 382.7 | 0.0% |
| Qatar | 105.8 | 94.0 | 67.3 | 46.6 | 106.4 | 43.8% |
| Romania | -1.5 | -0.1 | -0.1 | 0.0 | 103.6 | 0.0% |
| Russia | 1,945.8 | 1,241.2 | 128.9 | 43.6 | 2,335.9 | 1.9% |
| Rwanda | 0.0 | 0.0 | 0.0 | 0.0 | 0.0 | 0.0% |
| San Marino | 0.0 | 0.0 | 0.0 | 0.0 | 0.0 | 0.0% |
| Saudi Arabia | 180.1 | 0.2 | 0.0 | 0.0 | 323.1 | 0.0% |
| Senegal | 0.0 | 0.0 | 0.0 | 0.0 | 0.0 | 0.0% |
| Serbia | 30.8 | 24.2 | 20.1 | 4.8 | 41.2 | 11.7% |
| Singapore | 113.4 | 113.4 | 113.4 | 87.1 | 240.8 | 36.2% |
| Slovakia | -3.4 | 0.0 | 0.0 | 0.0 | 31.7 | 0.0% |
| Slovenia | -4.4 | 0.0 | 0.0 | 0.0 | 3.2 | 0.0% |
| Solomon Islands | 0.0 | -0.7 | -0.7 | -0.2 | 0.0 | 0.0% |
| South Africa | 1.6 | 0.3 | 0.1 | 0.1 | 125.4 | 0.1% |
| South Sudan | 0.0 | 0.0 | 0.0 | 0.0 | 0.0 | 0.0% |
| Spain | -241.7 | 0.0 | 0.0 | 0.0 | 281.6 | 0.0% |
| Sri Lanka | 1.6 | -15.5 | -13.2 | 0.0 | 6.7 | 0.0% |
| Suriname | 0.6 | -0.1 | -0.1 | -0.3 | 1.2 | -25.0% |
| Sweden | -59.7 | 0.0 | 0.0 | 0.0 | 125.7 | 0.0% |
| Switzerland | -452.3 | 0.0 | 0.0 | 0.0 | 1,040.0 | 0.0% |
| Syria | -0.1 | 0.0 | 0.0 | 0.0 | 25.8 | 0.0% |
| Taiwan | 0.9 | -0.9 | -0.9 | -0.9 | 422.7 | -0.2% |
| Tajikistan | 8.0 | 0.2 | -13.8 | 3.3 | 8.5 | 38.8% |
| Tanzania | 0.0 | 0.0 | 0.0 | 0.0 | 0.0 | 0.0% |
| Thailand | 150.5 | 82.1 | 80.5 | -9.7 | 234.5 | -4.1% |
| Timor-Leste | 0.0 | 0.0 | 0.0 | 0.0 | 0.0 | 0.0% |
| Togo | 0.0 | 0.0 | 0.0 | 0.0 | 0.0 | 0.0% |
| Trinidad and Tobago | 0.0 | 0.0 | 0.0 | 0.0 | 1.9 | 0.0% |
| Tunisia | 0.0 | 0.0 | 0.0 | 0.0 | 6.8 | 0.0% |
| Turkey | 660.0 | 263.2 | 269.2 | 63.7 | 776.1 | 8.2% |
| Ukraine | 7.2 | -13.0 | 2.5 | 0.7 | 27.1 | 2.6% |
| United Arab Emirates | 74.7 | 74.7 | 67.2 | 19.4 | 74.7 | 26.0% |
| United Kingdom | -2.2 | 0.0 | 0.0 | 0.0 | 310.3 | 0.0% |
| United States | -2.6 | 0.0 | 0.0 | 0.0 | 8,133.5 | 0.0% |
| Uruguay | -0.2 | -0.2 | 0.0 | 0.0 | 0.1 | 0.0% |
| Uzbekistan | 365.2 | 114.5 | 15.0 | 7.2 | 365.2 | 2.0% |
| Venezuela | -304.8 | -313.7 | -77.0 | -27.0 | 52.0 | -51.9% |
| Vietnam | 0.0 | 0.0 | 0.0 | 0.0 | 0.0 | 0.0% |
| Yemen | -1.6 | -1.6 | 0.0 | 0.0 | 0.0 | 0.0% |
| Zambia | 0.3 | 0.3 | 0.3 | 0.0 | 0.3 | 0.0% |
| Zimbabwe | -35.3 | 0.7 | 0.7 | 0.7 | 0.7 | 100.0% |
Which countries are buying the most gold for their reserves?

Why Do Central Banks Like Gold?
- Central banks like gold because the metal is expected to hold its value through turbulent times and, unlike currencies and bonds, it does not rely on any issuer or government. It also enables central banks to diversify away from assets like US Treasuries and the dollar.
- INN adds that central banks purchase gold…:
- to mitigate risk,
- to hedge against inflation and
- to promote economic stability…
- A Bloomberg opinion piece says central banks are buying it for the long term:
- to hedge political risk;
- to underpin their own currencies;
- to offset any decline in the value of the dollar; and in place of US government bonds, which given the rate at which the US is accumulating debt ($1 trillion every 100 days, says Bank of America Corp.) are no longer deemed to be free of risk…
- UBS says…central banks want to hold more bullion as a buffer against any current or future sanction and so It’s no surprise then to see Russia and China being the most aggressive gold buyers in recent years, accounting for about half of the total tonnage bought worldwide over the past two decades.
- Forbes Finance Council’s Sanford Mann describes the distinction perfectly: “Where US, European and Asian banks tend to see gold as a historical legacy asset, EMDE banks tend to see it as a strategic asset.”
Why Doesn’t the Central Bank Sell Its Gold?
…To my mind, it’s because egregious money-printing throughout the Western world has devalued currencies… Excessive borrowing and money-printing has caused the US debt to balloon to $35 trillion. The currency of every empire since the Romans, and their denarius, has eventually become worth less…
Conclusion
Notwithstanding their motivations for buying gold, the importance of central bank gold holdings cannot be understated…According to the World Gold Council, in mid-2023, 70% of central bankers polled in a survey said they expected global gold reserves to increase over the next 12 months. Central banks added 1,037Mt of gold to their vaults in 2023, the second year in a row they exceeded 1,000Mt. In the first quarter of 2024, CBs bought another record 290 Mt, of gold, reports the WGC.