We are now at the mercy of oil and the commodity markets. Bernanke’s plan to print our way to prosperity is destined to fail. Ultimately, he is just going to spike inflation and collapse the global economy, resulting in a worse downturn than what we saw in 2008/09. Let me explain. Words: 510
So says Toby Connor (www.goldscents.blogspot.ca) in edited excerpts from his original article* (which Lorimer Wilson, editor of www.munKNEE.com (Your Key to Making Money!), has further edited below for length and clarity – see Editor’s Note at the bottom of the page. This paragraph must be included in any article re-posting to avoid copyright infringement.)
Connor goes on to say, in part:
The Last “Four” Year Cycle Longest in History
The last “four” year cycle that started in 2002 and bottomed in the spring of 2009 was the longest “four” year cycle in history. It was stretched to these extreme lengths by Bernanke’s desperate strategy of debasing the currency to avoid the bear market that should have begun in 2006.
The Current “Four” Year Cycle Has Been Delayed
As I have mentioned before, often a long cycle will be followed by a short cycle and, this being the case, the current “four” year cycle should have bottomed in the fall of 2012 [see chart below]. That process had begun last year in May but was temporarily aborted by massive Central Bank printing.
Home Delivery Available! If you enjoy this site and would like to have every article sent automatically to you then go HERE and sign up to receive Your Daily Intelligence Report. We provide an easy “unsubscribe” feature should you decide to opt out at any time.
Pass it ON! Tell your friends and co-workers about the existence of what we think is one of the highest quality (content and presentation) financial sites on the internet. Visits to munKNEE.com have been doubling yearly and pages-per-visit and time-on-site continue to reach new highs. Spread the word. munKNEE should be in everybody’s inbox and MONEY in everybody’s wallet!
As such, as convincing as the current stock market rally has been, I am confident that what is happening now is an ending phase (that doesn’t mean that we won’t see a test or even a marginal break to new highs first ) and not the start a new secular bull market…
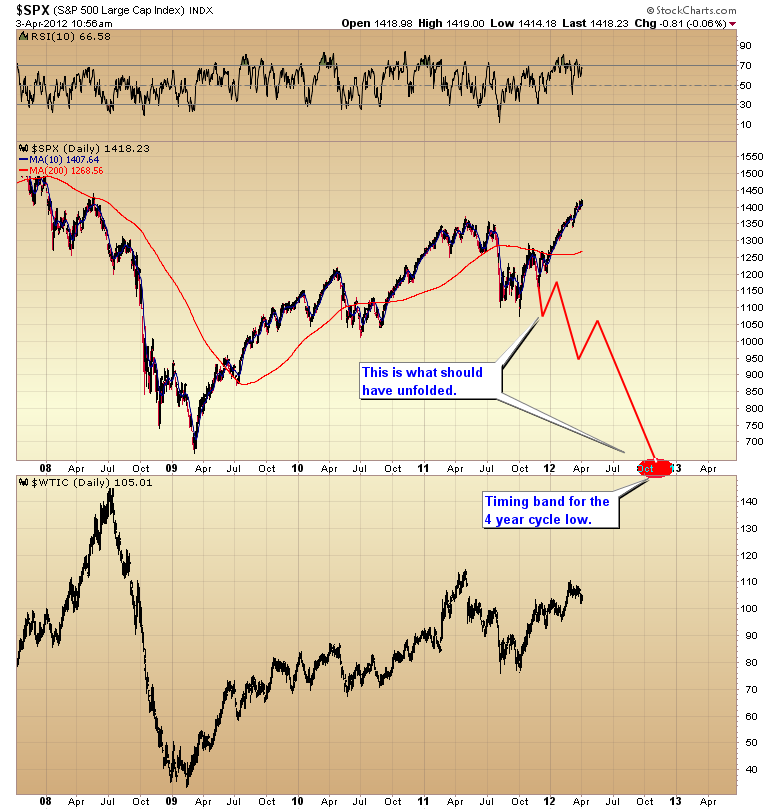
The Next “Four” Year Cycle Will End In A Great Depression
Amazingly, I think we are going to see another stretched “four” year cycle and this one is going to end just like the last one when the price of oil spiked far enough to collapse the global economy and create a market crash [see chart below]. The next economic downturn won’t be a Great Recession, it will be a Great Depression.

The Current Situation
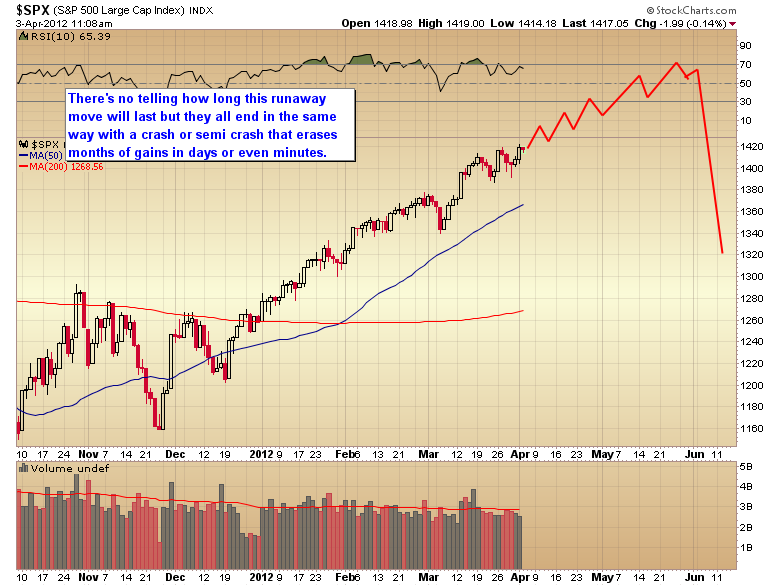
At the moment the stock market is in a runaway move very similar to what unfolded out of the summer 2006 yearly cycle low. These runaway moves are characterized by uniform mild corrections all of similar magnitude and duration. For this particular rally the corrective size has been roughly 25-35 points. This could continue for weeks or months, but all runaway moves end in the same fashion, with a crash or semi-crash that wipes out months of gains in a matter of days – or even minutes.
The Tipping Point
Generally speaking, once a corrective move has run 20% beyond the normal correction size that is the signal that the move is over [see chart above]. Unfortunately, [by that time] you are usually already into the ‘crash day’. This is why, at some point, (whether that breaking point is at $120 oil or $160 oil is anyone’s guess,) one has to say enough is enough, and stand aside, or risk getting caught in the crash.
Editor’s Note: The above article has been has edited ([ ]), abridged (…), and reformatted (including the title, some sub-titles and bold/italics emphases) for the sake of clarity and brevity to ensure a fast and easy read. The article’s views and conclusions are unaltered and no personal comments have been included to maintain the integrity of the original article.
Related Articles:
1. The Bull Market In Equities is NOT Over! Here’s Why

In spite of all the bearishness out there – the S&P 500 falling to 1,000 (David Tice),the market is overbought (John Hussman), its looking like the bear market of 2011 all over again (David Rosenberg), for example – I tend to disagree for 4 fundamental reasons. Let me explain. Words: 595
2. NOW Is the Time to Get Out of the Stock Market! Here’s Why

With the S&P 500 at its highest level since the summer of 2008, investors previously sidelined by reoccurring fears of a double dip recession and nagging worries about a disorderly Greek default may now be tempted to hold their noses and dive into the market where, presumably, they will be swept along to the land of outsized profits by the Dow 13,000 wave. Having said this, it is worth noting that often the best time to sell is when everyone else is buying. Now may be that time. [Let me explain.] Words: 885
3. S&P 500 Should Continue Climbing Until October and Then Decline 15-30%! – Here’s Why
At the end of November 2011 the U.S. behavioral indicator for the U.S. stock market, based on insights on investor psychology, touched the crisis threshold for the fifth time (1971,1979, 1986, 2006) since 1970. If the current case follows the four prior cases, we expect a similar positive return from November 2011 to the end of October 2012 as in the four prior periods followed by a decline somewhere between 15% and 30%. [Let me explain.] Words: 317
4. Fractal Analysis Suggests Dow Could Drop to 6,000 in 2012 and Gold Take Off Like It In 1979

5. What Does 2012, as an Election Year, Mean for Stock Market Returns? Here Are the Facts

Next year is a Presidential election year, and the stock market is almost always positive in election years. Right? At least that assurance has been a supposed truism for many decades, and repeated as fact each year in numerous interviews and financial columns. [Let’s explore just how correct those assumptions really are.] Words: 367
6. What Do the Presidential and Decennial Cycles Infer Will Happen in 2012?

Should we jump into the market now? [Let’s take a look at the 178 year history of the 4-year Presidential Cycles and the Decennial (10-year) Cycles and see what they suggest might well unfold in 2012.] Words: 1174
7. Dr. Nu Yu’s Latest Market Update on Gold/Silver, USD and Stock Market

What is currently transpiring with gold, silver, the US Dollar Index, 30-year U.S. Treasury bonds and the broad stock market is no surprise to those who follow my weekly market updates. Take a look. Words: 750
8. David Dreman More Accurately Forecasts Market Trends Than Most Anyone Else – Here Is His Record

We evaluate here the commentary of David Dreman at Forbes.com regarding the stock market via his archived articles since the beginning of 2001 [and what an accomplished record it is. He is tied for second place with Ken Fisher with a 64% accuracy rating which is well above the 46% rating of a list of 36 of his peers. Jack Schannep is the most accurate at 66%. Below are his market forecasts on specific sectors of the market over the years compared to how well said sectors actually did.] Words: 1706