“Follow the munKNEE” via twitter & Facebook
There has been a lot of media coverage about the United States’ debt issue these days. Why should we care? Because as U.S. citizens, we all own stock in this “company” called the United States of America (let’s say the ticker symbol is USA). We purchased this stock through the various taxes we pay every year (income tax, payroll tax, corporate tax) and we receive dividends through the various benefits we receive every year (security provided by defense budget, Medicare/Medicaid benefits, Social Security benefits, etc.). This article attempts to explain the U.S. national debt in simple layman’s terms by analyzing the United States and its debt issue as if it were a stock investment. Words: 1929; Charts: 5; Tables: 1
So writes Michael Fu in edited excerpts from his original article* on Seeking Alpha entitled The U.S. Debt Crisis Explained In Layman’s Terms.
This article is presented compliments of www.FinancialArticleSummariesToday.com (A site for sore eyes and inquisitive minds) and www.munKNEE.com (Your Key to Making Money!) and may have been edited ([ ]), abridged (…) and/or reformatted (some sub-titles and bold/italics emphases) for the sake of clarity and brevity to ensure a fast and easy read. The author’s views and conclusions are unaltered and no personal comments have been included to maintain the integrity of the original article. Please note that this paragraph must be included in any article re-posting to avoid copyright infringement.
Fu goes on to say, in part:
U.S. GDP = Market Value of a Company
The Gross Domestic Product, or GDP, is the market value of the goods and services produced within the United States in a period of time. A more technical definition of GDP is GDP = Consumption + Investment + Government Spending + (Exports – Imports).
The way I personally like to think about GDP is to view it as the market capitalization of our USA stock. The current GDP as of 3Q2012 is $15.8 trillion, or our USA stock has a market cap of $15.8 trillion (with a U.S. population of 314mm. Remember every U.S. citizen is like a stockholder of USA stock, a price per USA share would be around $50,000 per share). Given that the U.S. federal tax revenue per year is around $2.5 trillion (see more details below), this would imply our USA stock trades around 5.5x Revenue multiple ($15.8 trillion GDP divided by $2.5 trillion tax revenue).
In the past 20 years (1990-2011), the average annual GDP growth has been around 2.4%. In the past 10 years (2000-2011), the average GDP growth has only been 1.8%.
(click to enlarge) In other words, the U.S. is like a mature, large-cap stock growing at moderate pace of 2-3% a year. Emerging countries like China, India, Brazil, etc. that have 7-10% annual GDP growth rates are like high growth, mid-cap stocks.
U.S. National Debt = Total Debt of a Company
The current U.S. national debt is $16.3 trillion. This implies a current debt as a percent of GDP ratio of 103%! The only time in U.S. history when it has been higher was in 1945-46 post World War II when it reached 109%.
(click to enlarge)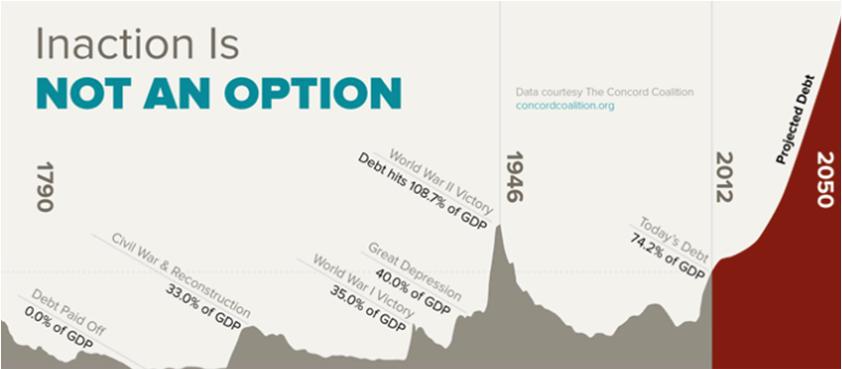
As shown below, in the past 10 years (2000-2011), the national debt has grown at an average of 9.3% per year. This compares to GDP only growing 1.8% per year in the same period.
(click to enlarge)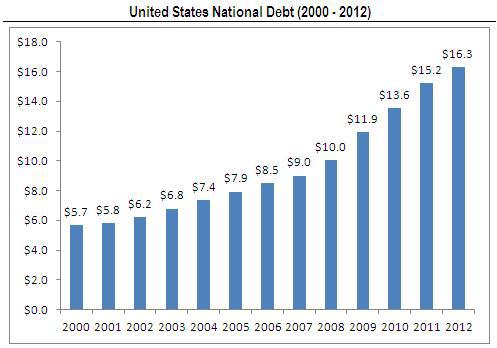
How does the debt to GDP ratio compare to other leading developed countries?
(click to enlarge)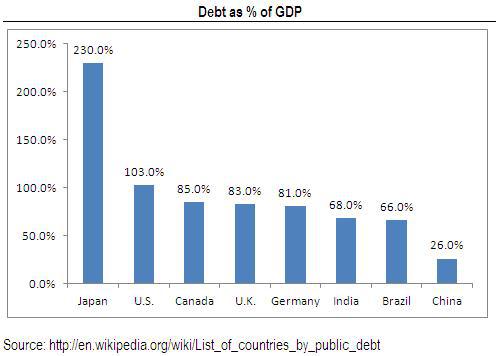
The U.S. has the highest debt to GDP out of the large, developed countries shown above, second only to Japan. What are some of the other countries that have a higher debt ratio than the U.S.?
- Greece 161%,
- Ireland 105%,
- Portugal 107%,
- Lebanon 136%,
- Jamaica 139%, and
- Barbados 117%.
Note that some of these countries are a fraction of the U.S. GDP, and several of these countries are countries related to the on-going Euro crisis. For a full listing of all countries statistics, please see here.
Now let’s compare the U.S. to other publicly traded stocks, in terms of its balance sheet and debt leverage ratios. The debt to market value (debt to GDP) ratio for the U.S. is over 100%, and the U.S. government debt is rated AAA-. There are currently only four publicly traded companies in the entire world that have a similar AAA debt rating:
- Johnson and Johnson (JNJ) 10%,
- Exxon Mobile (XOM) 5%,
- Microsoft (MSFT) 7%, and
- Automatic Data Processing (ADP) 2%.
By the way, I’m not even giving these companies credit for their large cash balances which in most cases would more than offset their debt amounts.
What types of companies do have similar leverage ratios of +100%? Well, they would include capital-intensive type industries such as:
- utilities (Duke (DUK) is 98%),
- telecom carriers (Verizon (VZ) is +100%),
- railroad operators (CSX (CSX) is 90%), and
- automakers (General Motors (GM) is 80-90%).
Note, these companies have much lower debt rating than the U.S., even though they have similar leverage ratios (VZ A+, HMC A+, DUK BBB+, CSX BBB and GM BB+).
Basically, the ratings agencies are not penalizing the U.S. as much (yet) for the high debt to GDP ratio, because the United States is still the default, go-to currency of the world (what other options are there, the pound, euro, yen, RMB, or hard assets like gold? U.K. and Japan has high leverage as well, the Euro has its own crisis, Chinese RMB is not liquid enough globally, gold is a non-productive asset).
Difference between Deficit and Debt
Let’s clarify the difference between the Annual Deficit and the National Debt. The deficit is the annual shortfall between federal tax revenue collected minus the federal spending every year. It’s similar to the “net loss” for the year of a company (if a company has more expenses than revenues, they have a net loss) and if a company has a net loss, they will then need to raise capital or borrow debt to fund that net loss.
The national debt on the other hand, is the total debt borrowed by the United States up to today. It’s the cumulative amount borrowed to fund all the prior years’ annual deficits (or annual net losses). Basically, the United States has been operating at a net loss (deficit or unbalanced budget) for a very long time now.
If the U.S. was a stock with annual losses, shareholders would have pressured management (government) to turn a profit (or balance our annual budget) a long time ago.
How did we get to $16.4 Trillion of National Debt
Let’s look at the past “CEOs” of our USA stock (or past Presidents of the U.S.), to see how we got to such a large national debt amount. In 1981, the total national debt was about $1 trillion, or below 50% of GDP. Over the next 20 years, each president did their share of adding to the deficit.
- In 1981: $1 trillion national debt
- Ronald Reagan (1981-1989): +$1.6 trillion
- George W.H. Bush (1989-1993): +$1.6 trillion
- Bill Clinton (1993-2001): +$1.5 trillion
- George W. Bush (2001-2009): +$4 trillion
- Barrack Obama (2009-2013): +$6 trillion
Granted some of this is due to funding wars at the time (Gulf War 1990-1991, Bosnian/Kosovo Wars 1995/1999, War on Terror 2001-Present) [while] some of this is also due to recessions (2000-2002 and 2007-2009).
Costs are Greater than Revenues
However, the primary cause of our debt issue is that for decades, we have managed to spend more than we collect in taxes each year. In other words, we have incurred a loss or deficit every year for decades now (except for a few years around 1998-2000), and every year we operate at a loss, we need to borrow more and more money.
(click to enlarge)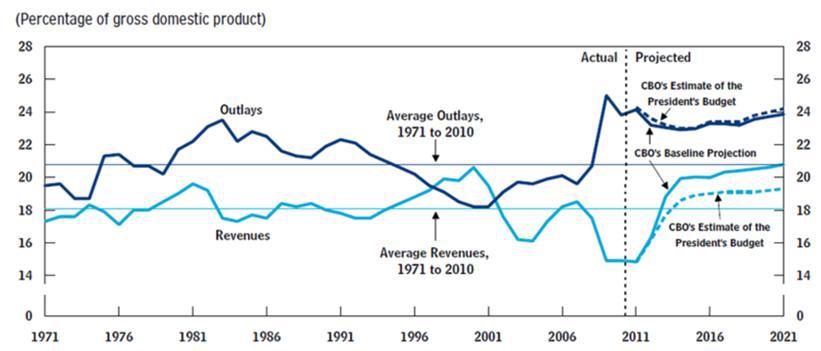
In the past +40 years, the government on average has collected 18% of GDP in Revenues each year. However, on average they have spent 21-22% of GDP on Expenses or Outlays per year. In 2012, the gap is even wider at 16% for Revenue and 23% for Expenses. From 1998-2000 (during Bill Clinton’s term), we did manage to balance our budget and have revenues exceed expenses, however for the other 38 years, we have spent more than we have received.
When you spend more than you receive, you need to borrow money to make up for that shortfall and add to the national debt. It’s no different than when individuals spend more per month than their monthly salary and need to borrow on their credit cards. We have gotten comfortable as a nation borrowing to fund current spending needs at the cost of future consequences (future generations need to eventually pay off that credit card tab).
Balancing our Budget
How do we match our annual revenues to equal our annual expenditures, so that we stop operating at a loss (deficit) every year and how do we eventually grow our annual revenues so that it exceeds our annual expenditures so that we can start to pay down the $16.3 trillion debt? This is the ultimate debate that U.S. politicians are having now, so let’s dig into the segments within federal revenue and expenditures to see what are the main drivers are:
(click to enlarge)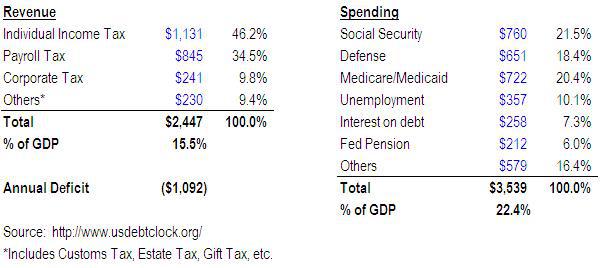
As you can see, we are currently running at an annual deficit (revenue minus expenses) of $1 trillion. This means that every year, we add an additional $1 trillion to our national debt amount, which is already at $16 trillion.
On the revenue side, the components are the following:
- individual income tax 45%,
- payroll tax 35%,
- corporate tax 10%, and
- other tax (including customs tax, estate tax, gift tax, etc.) 10%.
Note that total revenue taxes collected by the government can increase either by:
- raising the tax rate (remember that we still are enjoying lower tax rates from the Bush tax cuts), or
- stimulating the economy so that keeping existing tax rates the same still generates higher tax revenue (for example, 25% tax of higher $125,000 salary is greater than 25% tax on $100,000 of salary).
On the expenditure side, the components are the following:
- Social Security 22%,
- Medicare/Medicaid 20%,
- defense budget 18%,
- unemployment 10%,
- interest expense on national debt 7%,
- federal pension 6%, and
- others 14%.
Note a few things:
- Social Security and Medicare/Medicaid combined total 44% of our expenses every year, the majority of our expenses. These programs both will need significant reform if we are to fix our national debt crisis (without reform, social security will default in 20 years and starting 2033, people will only get 75% of their entitled social security benefits).
- The defense budget alone is 18% of our expenses, or $650 billion, every year. Back in 2000, the defense budget was only $300 billion, half of today’s amount.
- Unemployment benefits are abnormally high and costs us $350 billion a year. This would decrease as the economy improves and unemployment rates come down.
- Interest expense on our national debt cost us $260 billion a year. Remember that the U.S. Government is borrowing at all-time low rates right now (30 year Treasuries 2.94%, 5 year Treasuries 0.8%, and 1 year Treasuries 0.16%). The U.S. is currently able to spend and push off solving our debt problems partly because they can borrow at ridiculously cheap rates (if we could borrow on our credit cards at less than 1% for 5 years, I’m sure we all would become addicted to borrowing as well). However, the current low rate environment will not last much longer. When interest rates start going up (when other countries begin demanding higher rates for lending us money), our annual interest expense of $260 billion will rise significantly.
Conclusion
Fixing our U.S. debt crisis is a highly complicated and politically sensitive issue that much smarter economists, politicians and business CEOs are all debating on how to fix. The point of this article was not to offer a solution to this complex problem. The point of this article was to attempt to summarize this complicated issue into simple terms so that all of us can follow and discuss this important issue. The way I personally like to simplify our debt issue is to view the U.S. as if it were a stock investment:
- U.S. Market Cap (or GDP) = $16 trillion
- U.S. National Debt = $16 trillion
- Debt / Market Cap = 100% (highly leveraged)
- Federal Revenue = $2.5 trillion (or USA trades at 5.5x Revenue multiple)
- Federal Expenditures = $3.5 trillion
- Annual Deficit (or Net Loss) = Revenue – Expenses = -$1 trillion
In other words, if the U.S. [were a stock it would be seen as] highly levered (100% debt/market cap) and operating at a net loss every year. Not too many investors would invest in a stock with those types of fundamentals. I sincerely hope that our elected government officials can work together to resolve political differences and finally get the U.S. back on track and make our country a great investment once again.
Sign up HERE to receive munKNEE.com’s unique newsletter, Your Daily Intelligence Report
- FREE
- The “best of the best” financial, economic and investment articles to be found on the internet
- An “edited excerpts” format to provide brevity & clarity to ensure a fast & easy read
- Don’t waste time searching for articles worth reading. We do it for you!
- Sign up HERE and begin receiving your newsletter starting tomorrow
- You can also “follow the munKNEE” via twitter & Facebook
*http://seekingalpha.com/article/1081791-the-u-s-debt-crisis-explained-in-layman-s-terms
Related Articles:

“World Debt 101″ examines some of the world’s largest economies and illustrates just how much they have borrowed and what measures many of their governments are now taking to curb spending and narrow those deficits.

Many articles are being written these days that more or less scope the dire financial circumstances the U.S. is in. That being said, I had not been able to find one “analyst” – even one – who had the guts to outline the probable outcome and general hopelessness of the situation and to offer any meaningful prescription for investors to survive this coming catastrophe – until now. Words: 710
3. U.S.’s Runaway Financial Train is About to Destroy the Status Quo

People riding a runaway train can party and remain oblivious to the fact that the train is about to crash into a huge obstacle. Our runaway financial train is about to destroy the status quo as it crashes into the obstacle of mathematical consequences – the inevitable financial train wreck. “If something cannot go on forever, it will stop.” [Let me explain.] Words: 974

It’s easy to find analysts and investors who are certain that a deal [to avoid the fiscal cliff] will be reached, or at least that the can will be kicked down the road to buy more time. It’s also easy to find more pessimistic views that are based on the lack of cooperation in the past, and a deeply polarized country and political system. However, I think many are missing the point, which is that austerity is coming to America – taxes are going up and government spending will be reduced – [and. as such,] the United States is likely to face a recession and market correction in 2013, regardless of whether or not a compromise is reached over the Fiscal Cliff. Words: 970
5. Take Note: Don’t Say You Weren’t Forewarned!
It is relatively easy to predict further commodity price inflation as a result of the massive money printing going on worldwide and that hard assets, not paper assets, will help protect purchasing power but it is much more difficult to project where else this money printing leads and to what extent a crash is inevitable. What is the endgame? Will it be another financial crash such as in 2008 or will it be a more destructive financial and economic crash that causes a severe but temporary disruption in the delivery of goods and services? Words: 1470
6. A Must Watch Video On Why America Is In A “Death Spiral”

The video* below is one of the best overviews of what is going on and one of the best explanations of what lies ahead that I have heard. As such, in my opinion, it is A Must Watch!
7. These 25 Videos Warn of Impending Economic Collapse & Chaos

The internet is awash (drowning?) in hundreds of doom and gloom videos providing dire warnings of coming world depression, food shortages, rioting in the streets, rampant (hyper) inflation, deepening banking crisis, economic apocalypse, financial Armageddon, the demise of America – well, you get the idea. Below is a small sample of such videos with a hyperlink to each.

Warning: New evidence points toward an imminent financial collapse and the destruction of American wealth. Income, investments, retirement, and even personal safety are now at severe risk. In this new video I lay it all out for you. Words: 515
9. The Top 18 Economic Documentaries

Economic Reason has gathered together the Top 18 ‘reality’ economic documentaries which are bought to you by www.munKNEE.com.
10. Almost 3 Million Views! Why U.S. Debt & Budget Will NEVER Balance
This short video – on the sustainability of government spending – should be watched by everyone, including those not yet old enough to vote. It should be shown in every high school and college classroom.
11. The U.S. Economy is Going to Collapse…It is Unavoidable…It’s a Mathematical Certainty…Here’s Why
The level of debt has surpassed the possibilities of being serviced. Mathematically, the debt problem cannot be solved, regardless of economic policies. That, unfortunately, is written. For it to be serviceable would be to violate the laws of mathematics and that cannot happen. [As such, America is quickly approaching a catastrophic economic collapse. As repelling as that sounds, it’s in your own best interest to learn just how bad the situation is. This article is an attempt to do just that.] Words: 310

“The end of the world as we know it” is what David Korowicz predicts is coming sometime this decade – an “ultimate” crash that will be irreversible – TEOTWAWKI! Words: 1395
13. The Average U.S. Citizen Is Clueless Regarding the Desperate Shape the Country Is In! Are You?
The corrosive nature of politics and government has destroyed the economy and the moral fiber of citizens. These issues are not insurmountable, but they are very close to being so. Their ramifications are potentially existential in nature: the average length of life, the very time span or cycle of a nation has been proven in history to be approximately 250 years. Since the USA was born in 1776 this says we have about 14 years of life remaining for America. The way things are going we don’t doubt it. [Let me explain.] Words: 768
14. If You Are Not Preparing For a US Debt Collapse, NOW Is the Time to Do So! Here’s Why
Timing the U.S. debt implosion in advance is virtually impossible. Thus far, we’ve managed to [avoid such an event], however, this will not always be the case. If the U.S. does not deal with its debt problems now, we’re guaranteed to go the way of the PIIGS, along with an episode of hyperinflation. That is THE issue for the U.S., as this situation would affect every man woman and child living in this country. [Let me explain further.] Words: 495
15. This Will NOT End Well – Enjoy It While It Lasts – Here’s Why
…The US Government and its catastrophic fiscal morass are now viewed by the world as a ‘safe haven’. This would easily qualify for a comedy shtick if it weren’t so serious….[but] the establishment is thrilled with these developments because it helps maintain the status quo of the dollar standard era. However, there are some serious ramifications that few are paying attention to and are getting almost zero coverage from traditional media. [Let me explain what they are.] Words: 1150

Over the past few years, policy leaders worldwide have grown accustomed to kicking the can down the road with each step in this ongoing financial crisis making incremental moves rather than cultivating viable long term solutions. More recent attempts seem to have evolved into simply just trying to kick the can out of the driveway. Now we fear there may not be enough firepower left to simply kick the can over. [Having done so, we are left between the proverbial rock and a hard place.] If lawmakers do nothing, by all accounts we are likely to see a recession. Should lawmakers extend the Bush-era tax cuts, you make no progress towards long term deficit reduction, potentially raising the risk and magnitude of a future financial crisis. [Let me discuss this predicament further and how best to invest in such precarious times.] Words: 1602
17. John Mauldin: The Next Few Years Are Not Going To Be Pretty – Here’s Why
The next few years are not going to be pretty. We’re looking right into the teeth of a rolling global deleveraging recession—the End Game, I’ve called it – and the decisions we make in the next couple years about how to handle our debts and budget deficits here in the U.S., in Europe, in China, in Japan, and elsewhere, are going to be absolutely crucial. Words: 507
18. Events Accelerating Towards an Ultimate Dollar Catastrophe! Here’s Why
With the U.S. election just months off, political pressures will mount to favor fiscal stimulus measures instead of restraint. Such action can only accelerate higher domestic inflation and intensified dollar debasement culminating in a Great Collapse – a hyperinflationary great depression – by 2014. [Let me explain why that is the inevitable outcome.] Words: 2766
19. Major Inflation is Inescapable and the Forerunner of an Unavoidable Depression – Here’s Why
Whether our current economic crisis will end with massive inflation or in a deflationary spiral (ultimately, either one results in a Depression) is more than an academic one. It is the single most important variable for near and intermediate term investing success. It is also important in regard to taking actions which can prepare and protect you and your family. [Here is my assessment of what the future outcome will likely be and why.] Words: 1441
20. An Inflation Inferno is Expected – but When?
Daniel Thornton, an economist at the Federal Reserve Bank of St. Louis, argues that the Fed’s policy of providing liquidity has “enormous potential to increase the money supply,” resulting in what The Wall Street Journal’s Real Time Economics blog calls “an inflation inferno.” [Personally,] I think it’s too soon to make significant changes to a portfolio based on inflation fears. Here’s why. Words: 550
21. Major Price Inflation Is Coming – It’s Just a Matter of Time! Here’s Why
The developed economies of the world have opened the money spigots…[and this] massive money and credit creation is sitting in the banking system like dry tinder just waiting for a spark to set it ablaze. How quickly it happens is anyone’s guess, but once it does we are likely to be enveloped in a worldwide inflation unlike anything before ever witnessed. [Let me explain further.] Words: 625
22. U.S Likely to Hit the Financial Wall by 2017! Here’s Why
The deficits aren’t going to stop anytime soon. The debt mountain will keep growing…Obviously, the debt can’t keep growing faster than the economy forever, but the people in charge do seem determined to find out just how far they can push things….The only way for the politicians to buy time will be through price inflation, to reduce the real burden of the debt, and whether they admit it or not, inflation is what they will be praying for….[and] the Federal Reserve will hear their prayer. When will the economy reach the wall toward which it is headed? Not soon, I believe, but in the meantime there will be plenty of excitement. [Let me explain what I expect to unfold.] Words: 1833