“Where breadth goes, the market usually follows,” goes an old market adage and as Richard Russell said recently, “In a deteriorating market breadth situation where the ‘soldiers’ are deserting even while the ‘generals’ continue to march forward would be a prelude to disaster. In the stock market, it may be the same.” [Let’s review the current situation and see where we’re at.] Words: 478
So says Prieur du Plessis (www.investmentpostcards.com) in an article* which Lorimer Wilson, editor of www.munKNEE.com , has further edited ([ ]), abridged (…) and reformatted below for the sake of clarity and brevity to ensure a fast and easy read. Please note that this paragraph must be included in any article re-posting to avoid copyright infringement. du Plessis goes on to say:
Breadth indicators are useful tools to assess the inner workings of the market’s rallies or corrections, and are used to identify strength or weakness behind market moves, i.e. to assess how the bulls and the bears are exerting themselves. [To read more about how to use a multitude of other technical indicators read these articles here (1), here (2), and here (3).]
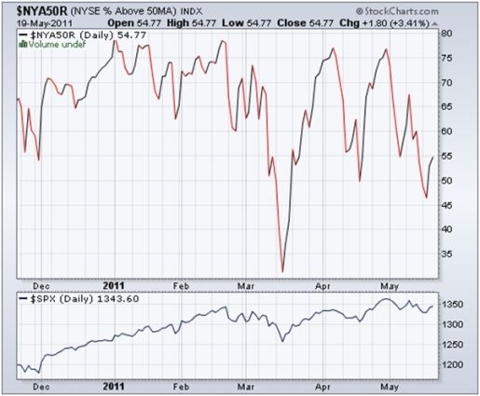
Let’s consider one measure of stock market “internals”: The number of NYSE stocks trading above their respective 50-day moving averages has declined to 55% from more than 75% at the end of April (see top section of chart below). In order to be bullish about the secondary or intermediate trend, one would expect the majority of stocks to trade comfortable above the 50-day line. Although the indicator is back above 50 after a dip below this level a few days ago, the outlook for the intermediate trend has weakened over the past few weeks, but it is premature to cry “wolf”.
Sign up for FREE weekly “Top 100 Stock Index, Asset Ratio & Economic Indicators in Review” report
For a primary uptrend to be in place, the bulk of the index constituents also need to trade above their 200-day averages. The number at the moment is 76% – somewhat down from its early April high of 83%, but nevertheless still firmly in bullish territory.

Source: StockCharts.com
Conclusion
[To repeat Richard Russell’s comments:]“This deteriorating market breadth situation is a bearish picture. The ‘soldiers’ are deserting even while the ‘generals’ continue to march forward. In a war, this would be a prelude to disaster. In the stock market, it may be the same.”
Links and Titles of Articles Referenced Above:
- Ride the Market Waves With These 6 Momentum Indicators https://www.munknee.com/2011/05/ride-the-market-waves-with-these-6-momentum-indicators/
- Here’s How to Time the Market! https://www.munknee.com/2011/05/time-the-market-by-using-these-market-strength-and-volatility-indicators/
- Yes, You Can Time the Market – Use These Trend Indicators https://www.munknee.com/2011/05/timing-the-market-using-trend-indicators/
*http://www.investmentpostcards.com/2011/05/20/sp-500-%E2%80%93-the-%E2%80%9Csoldiers-are-deserting%E2%80%9D-says-richard-russell/
Editor’s Note:
- The above article consists of reformatted edited excerpts from the original for the sake of brevity, clarity and to ensure a fast and easy read. The author’s views and conclusions are unaltered.
- Permission to reprint in whole or in part is gladly granted, provided full credit is given as per paragraph 2 above.
Technicals
 munKNEE.com Your Key to Making Money