 markets, avoiding fresh exposure to equities at these levels and selling some of one’s equity holdings. Long-term investors can still ignore the volatility and buy quality stocks, however, it would make more sense to buy the same stocks after the markets decline 10%-15% than buying it at current levels. [Let me explain more fully.] Words: 665
So says the Economic Fanatic (www.economicfanatic.com) in edited excerpts from an article posted on Seeking Alpha.
Lorimer Wilson, editor of www.munKNEE.com (Your Key to Making Money!) has edited the article below for length and clarity – see Editor’s Note at the bottom of the page. This paragraph must be included in any article re-posting to avoid copyright infringement.
The article goes on to say, in part:
Factor #1: The VIX
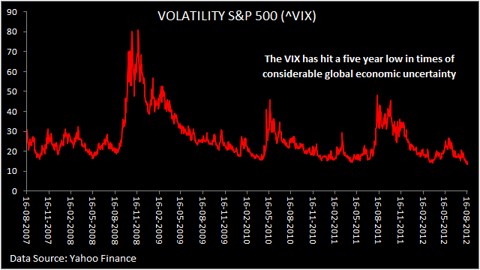
The first factor pointing to a possible reversal in the S&P 500 index is the fact that the VIX has touched a five-year low of 13.45 at the end of last Friday’s trade.
Click to enlarge
VIX, also known as the fear index, is a measure of the market participant’s expectation of volatility over the next 30 days. A low VIX would, therefore, mean low volatility expectation and should not really concern investors.
Factor #2: The VIX in Relation to the S&P 500 Index
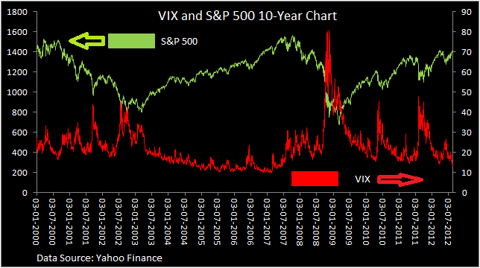
My caution, however, comes from the observation and behavior of the VIX in relation with the S&P 500 index in the last 10 years [see below].
As the chart shows, there has always been a reversal in the VIX index from lower levels and it has been associated with decline in equity markets. The period of 2003-07 was an exception as a globally synchronized boom was underway and equity markets trended higher.
Of course, just the past trend does not make me believe that the VIX will increase leading to a decline in stocks. Apart from encouraging statements, there has been a lack of action by central bankers. The global economy is also on a downturn and the next 3-6 months will witness policy action to support the economy and markets. These events do lead to increased volatility and markets can correct from near-term overbought levels.
Factor #3: S&P 500 P/E Valuation
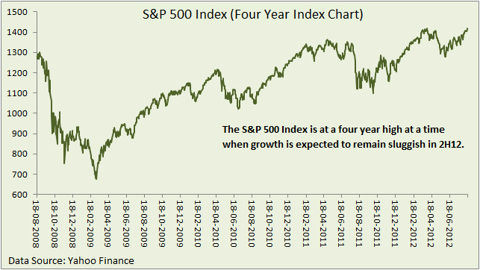
There are several reasons to believe that markets are overbought. Before I discuss that, I would like to mention that markets are not terribly overvalued when it comes to P/E valuation. The markets are currently trading at 14 times TTM earnings.
However, markets can correct after an 11% rally in the last two months in the absence of any significant positive cue. Markets are also trading at a four-year high, and it is concerning to see markets at these levels amidst a global slowdown.
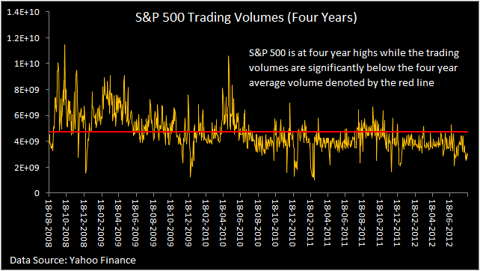
Factor #4: S&P 500 Trading Volumes
Adding to concerns is the fact that the rally has been associated with declining volumes. I am not an expert technical analyst. However, I do understand that a market rally on low volumes is not a great sign.
Underscoring my point of near-term overbought markets are the next two charts.
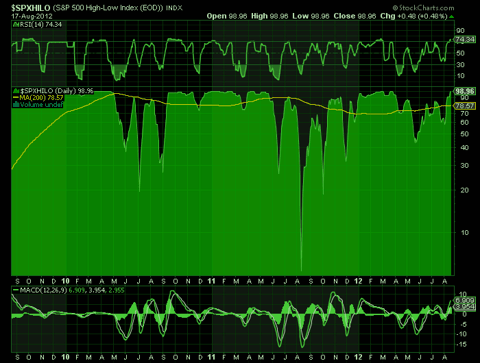
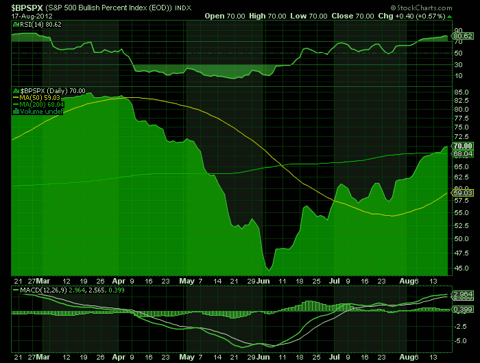
The first chart gives the S&P 500 high-low index and the second gives the S&P 500 bullish percent index.
Factor #5: The S&P 500 High-Low Index
The S&P 500 high-low index is calculated by taking new highs divided by the new lows made in the S&P 500 index. The index has surged to 98.96 as of August 17, 2012, from a low of 43 in May 2012. Clearly, [as can be seen in the chart below,] there are a significant number of highs being made in the S&P 500 stocks compared to the number of lows. In general, this is a sign of markets topping out in the near term.
Factor #6: The S&P 500 Bullish Percentage Index
The S&P 500 Bullish Percentage Index [see chart above] also points to overbought conditions. In general, a reading of over 70 indicates overbought conditions and a reading of over 80 indicates an even stronger overbought signal. Currently, the bullish percentage index is exactly at 70.
Conclusion
While I believe the S&P 500 index will do reasonably well over the next 3-5 years the above 6 factors combined make a strong case for avoiding the equity markets in the foreseeable future. Long-term investors can still ignore the volatility and buy quality stocks, however, it would make more sense to buy the same stocks after the markets decline 10%-15% than buying it at current levels.
*http://seekingalpha.com/article/815251-exit-equities-as-vix-hits-a-5-year-low-and-s-p-500-index-a-4-year-high (To access the above article please copy the URL and paste it into your browser.)
Editor’s Note: The above post may have been edited ([ ]), abridged (…), and reformatted (including the title, some sub-titles and bold/italics emphases) for the sake of clarity and brevity to ensure a fast and easy read. The article’s views and conclusions are unaltered and no personal comments have been included to maintain the integrity of the original article.
Related Articles:
1. I’m Worried About the Likelihood of a Sharp Market Decline This Fall – For These Reasons
Back in April and May, it looked like the economy was falling apart, the euro was going to come unglued, and stocks were going to plunge. Sentiment was extremely bearish and volatility was jumping. Now in August, you can’t find a bear anywhere on Wall Street! Me? I continue to be worried about the likelihood of a sharp market decline this fall for several reasons which I share with you below. Words: 495
2. Marc Faber: We Could Have a Crash Like in 1987 This Fall! Here’s Why
Marc Faber has stated in an interview* on Bloomberg Television that “I think the market will have difficulties to move up strongly unless we have a massive QE3 (something Faber thinks would “definitely occur” if the S&P 500 dropped another 100 to 150 points. If it bounces back to 1,400, he said, the Fed will probably wait to see how the economy develops)….. If the market makes a new high, it will be with very few stocks pushing up and the majority of stocks having already rolled over….If it moves and makes a high above 1,422, the second half of the year could witness a crash, like in 1987.” Words: 708
3. Goldman Sachs’ Leading Indicators Signal Steep Market Crash Ahead
Goldman Sachs reports their Global Economic Indicators (GLI) show the world has re-entered a contraction and…is predicting a market crash worse than that of the early 90′s recession and one slightly less than the sell-off at the turn of the millennium. [Below are graphs to support their contentions.] Words: 250
4. Harry Dent Sees Dow 3,000; Seth Masters Sees Dow 20,000! Who’s Most Likely Right?
Harry Dent, the financial newsletter writer and CEO of economic forecasting firm HS Dent, has one of the most bearish calls on stocks we’ve heard in a while. Appearing on CNBC yesterday, Dent explained the demographics-driven thesis behind his Dow 3000 call.
5. Charles Nenner: Dow to Peak in 2012 and Then Decline to 5,000!
Charles Nenner has been accurately predicting movements in the liquid markets for more than 25 years, and his most recent cycle analysis predicts that the current stock market rally is going to last through Q2 and then begin a major descent in 2013 – with the Dow eventually reaching 5,000! Read on to learn how Nenner’s unique system works and what he forecasts for commodities, currencies, bonds, interest rates and more. Words: 400
6. Fractal Analysis Suggests Dow Could Drop to 6,000 in 2012 and Gold Take Off Like In 1979
7. Ignore Guru Opinions: 66% Get It WRONG More Than 50% of the Time! Here’s How They Compare
8. Black-Scholes “Volatility Smile” Suggests S&P 500 Could End 2012 15% Higher – Here’s Why
9. Fitzpatrick: Consumer Confidence Double-Top Suggests Stocks Could Plunge
10. The Bulls vs. the Bears: Which Direction are Stock Prices Going?
11. CITI’s “Investment Clock” Is at 8 O’clock – Here’s What That Means
 munKNEE.com Your Key to Making Money
