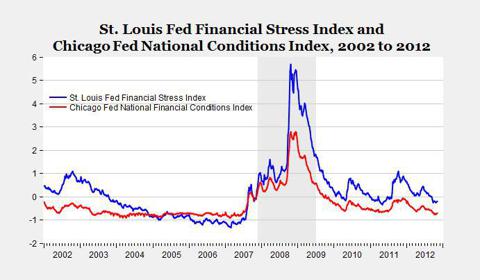
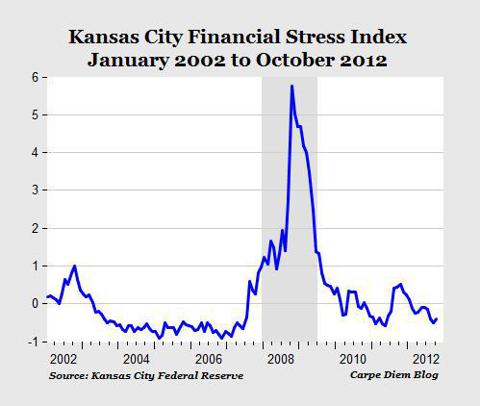
None of the three different statistical measures of financial stress released this  week suggest any conditions in the financial markets that would indicate that the U.S. economy is in a recession already, and none of them are exhibiting any upward trends that would point to a pending recession. In fact, all three stress measures have been trending downward through 2012, indicating that there is less financial stress now than at the beginning of the year. [Take a look at what each has to say and judge for yourself.] Words: 571
So says Mark J. Perry (www.aei-ideas.org) in edited excerpts from his original article* entitled Financial Stress In U.S. Financial Markets Remains Low By 3 Statistical Measures, And Has Been Trending Downward.
Perry goes on to say, in part:
Lorimer Wilson, editor of www.munKNEE.com (Your Key to Making Money!) and www.FinancialArticleSummariesToday.com (A site for sore eyes and inquisitive minds), may have edited the article below to some degree for length and clarity – see Editor’s Note at the bottom of the page for details. This paragraph must be included in any article re-posting to avoid copyright infringement.
Here are descriptions and more details for each of the stress indices alluded to above:
1. The St. Louis Fed Financial Stress Index (STLFSI) is calculated using the principal components procedure based on 18 weekly data series that include seven interest rates, six yield spreads, and five other financial variables. For the last nine weeks, the STLFSI has been below zero (lower values indicate less stress, see blue line in top chart), and has generally been trending downward for the last year. The current measure of financial stress for the week ending last Friday at -.194 is below the historical average of zero.
2. The Chicago Fed National Financial Conditions Index (NFCI) is based on 100 financial indicators consisting of 47 weekly, 29 monthly, and 24 quarterly variables, and has proven to be a highly predictive and robust indicator of financial stress at leading horizons of up to one year. Empirical analysis indicates that the NFCI is 95 percent accurate in identifying historical crises contemporaneously. Increasing risk, tighter credit conditions and declining leverage are consistent with tightening financial conditions are associated with positive values for the NFCI, while negative values indicate the opposite. The NFCI has been negative for the last three years, and has been trending downward for the last year (see red line in top chart). At -0.71 for the first week of November, the NFCI is well below its historic average of -0.40.
Sign up HERE to receive munKNEE.com’s unique newsletter, Your Daily Intelligence Report
- It’s FREE
- It contains the “best of the best” financial, economic and investment articles to be found on the internet
- It’s presented in an “edited excerpts” format to provide brevity & clarity of content to ensure a fast & easy read
- Don’t waste time searching for articles worth reading. We do it for you and bring them to you each day!
- Sign up HERE and begin receiving your newsletter starting tomorrow
3. The Kansas City Fed Financial Stress Index (KCFSI) is a monthly composite index of 11 financial variables (yield spreads and asset prices) and the KCFSI is calculated using the principal components analysis. According to Thursday’s press release, the Kansas City Financial Stress Index for the month of October continues to indicate that financial stress in the U.S. financial system remains low. The October KCFSI was -0.40 in October, a slight increase from September’s index, but below its long-run average of zero. For the last nine months starting in February, the KCFSI has been negative (lower values indicate less financial stress), and the general trend over the last year has been downward.
Bottom Line
Based on statistical measures of financial market stress from three district Federal Reserve banks, financial stress in the U.S. financial system remains low through the end of October (for the monthly KCFSI) and into the first week of November (for the weekly indexes).
Who in the world is currently reading this article along with you? Click here
Past recessionary periods have been associated with rising index values for all three financial stress indicators, and we’re now seeing the opposite – all three indexes have been trending downward for the last year. Taken together, these three stress measures provide no evidence that the U.S. economy is in recession now, and no evidence that a recession is pending.
*http://www.aei-ideas.org/2012/11/financial-stress-in-us-financial-markets-remains-low-by-three-statistical-measures-and-has-been-trending-downward/
Editor’s Note: The above post may have been edited ([ ]), abridged (…), and reformatted (including the title, some sub-titles and bold/italics emphases) for the sake of clarity and brevity to ensure a fast and easy read. The article’s views and conclusions are unaltered and no personal comments have been included to maintain the integrity of the original article.
Related Articles:
1. US Recession Probabilities Index Says “Yes”, My Indicators Say “No” – Is This Time Different?
The US Recession Probabilities Index is currently at a level that has ALWAYS been followed by a recession. Interestingly, however, I don’t see recession signals in the internal indicators that I follow and which have been right for a long time now so this clearly puts that opinion in the “this time is different” category – or does it? Words: 255
Over the past few years, policy leaders worldwide have grown accustomed to kicking the can down the road with each step in this ongoing financial crisis making incremental moves rather than cultivating viable long term solutions. More recent attempts seem to have evolved into simply just trying to kick the can out of the driveway. Now we fear there may not be enough firepower left to simply kick the can over. [Having done so, we are left between the proverbial rock and a hard place.] If lawmakers do nothing, by all accounts we are likely to see a recession. Should lawmakers extend the Bush-era tax cuts, you make no progress towards long term deficit reduction, potentially raising the risk and magnitude of a future financial crisis. [Let me discuss this predicament further and how best to invest in such precarious times.] Words: 1602
3. We’ve Reached the Tipping Point: Are Consumers Prepared to Save the Day?
Injecting massive amounts of liquidity into the banking system can spur dramatic economic growth if that liquidity is used. On the other hand, if public perception is negative and fearful, that liquidity remains untapped and no growth occurs. We are in a new earnings season and for the most part – based on lowered expectations – the numbers are looking OK so what should we expect based on these modestly improving numbers? Words: 2176
4. U.S. Economy In the ‘Eye Of The Storm’ – Here’s Why
Optimism has seized stock markets in the past month on the back of better economic data in the United States and a late-summer lull in the euro crisis. Market volatility is at its lowest level in years. [That being said, however,] BofA’s top economist Ethan Harris…thinks the U.S. economy is “in the eye of the storm” right now. Below is what Harris sees on the horizon. Words: 363
5. QEunlimited is NOT Going to Save the U.S. Economy – Period!
With the pop from the USFed’s latest attempt at financial shock and awe already seeping from lackluster markets, and the teleprompter news networks losing steam over their promotion of the same, it is time to take a look back at the decisions made on 9/13/2012 and set the record straight on some things.
6. QE 3 Will Actually SUPPRESS the Economy! Here’s Why
The Fed professes that QE 3 or as I call it, QE Infinity (QEI), will create jobs but I am not sure how they can expect anybody to buy their rationale. As we know, QE 1 and QE 2 did very little in the way of creating jobs. Might the Fed realize that QE Infinity could actually be counter-productive to economic growth?
 munKNEE.com Your Key to Making Money


