“Follow the munKNEE” via twitter & Facebook or Register to receive our daily Intelligence Report
Higher (lower) inflation expectations have remained closely bound with higher (lower) stock prices [of late but] this odd connection won’t last forever…[but] until that changes, it’s best to go with the flow….[This article explains] the new abnormal. Words: 266
So writes James Picerno (www.capitalspectator.com) in edited excerpts from his original article* entitled Mr. Market’s Abnormal Relations – An Update.
This article is presented compliments of www.FinancialArticleSummariesToday.com (A site for sore eyes and inquisitive minds) and www.munKNEE.com (Your Key to Making Money!) and may have been edited ([ ]), abridged (…) and/or reformatted (some sub-titles and bold/italics emphases) for the sake of clarity and brevity to ensure a fast and easy read. Please note that this paragraph must be included in any article re-posting to avoid copyright infringement.
Picerno goes on to say in further edited excerpts:
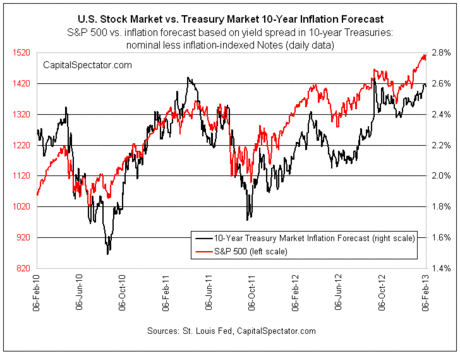
The new abnormal is the positive connection between the stock market and the implied inflation forecast via the yield spread between the 10-year Treasury note and its inflation-indexed counterpart.
As the chart below shows, the S&P 500 has been rising so far in 2013, echoing a similar advance in inflation expectations.
What’s behind this connection? The short answer: fear of disinflation/deflation. David Glasner lays out a broader, deeper economic explanation in a 2011 paper titled “The Fisher Effect Under Deflationary Expectations.”
The main takeaway for investors: Mr. Market likes higher inflation these days, but he becomes anxious when the outlook for inflation falls. That’s a sign that the state of macro is, shall we say, off its game. Until that changes, it’s best to go with the flow. As such, keep your eye on the market’s estimate of future inflation for a clue about the future path of stock prices. In particular, a change in the trend for inflation expectations is likely to bring a similar reversal in equity prices.
On that note, expected inflation is now roughly at levels that prevailed before the financial crisis struck in September 2008 — around 2.6%. Inflation has come full circle since the global economy had a near-death experience.
The questions before the house: Can inflation expectations break through this ceiling to higher ground? If so, will the stock market continue to view higher inflation as a positive?
Editor’s Note: The author’s views and conclusions are unaltered and no personal comments have been included to maintain the integrity of the original article. Furthermore, the views, conclusions and any recommendations offered in this article are not to be construed as an endorsement of such by the editor.
*http://www.capitalspectator.com/archives/2013/02/mr_markets_abno.html#more
Register HERE for Your Daily Intelligence Report Newsletter
It’s FREE
The “best of the best” financial, economic and investment articles
An “edited excerpts” format to provide brevity & clarity for a fast & easy read
Don’t waste time searching for informative articles. We do it for you!
Register HERE and automatically receive every article posted
“Follow Us” on twitter & “Like Us” on Facebook
Related Articles:
1. Inflation: What Do the Non-CPI Inflation Gauges Say It Is?
Whenever the BLS posts their monthly CPI there’s always the same response from critics that the index is flawed. That’s fine. I think a healthy dose of skepticism regarding government data is perfectly good. So let’s take a look at some independent gauges to see where prices are.
2. The Big Mac Index Reveals the REAL Facts On U.S. Inflation!

A look at the trend in prices of the Big Mac clearly shows that investors are being penalized with higher inflation, lower income from bonds and certificates of deposit and being led to believe that the economy is growing better than it really is. [Let me explain.] Words: 1012; Charts: 2
3. These 6 Charts Illustrate That Hyperinflationary Pressure in America Is Growing
The six charts I provide in this article illustrate why the hyperinflationary pressure in America is growing. This is not necessarily a forecast for hyperinflation – this is simply a demonstration that some of the precursors to a hyperinflationary cliff are building. (Words: 1001; Charts: 7)
4. Bull Market in Stocks Isn’t About to End Anytime Soon! Here’s Why

As we all know, money printing always leads to inflation. It’s just a matter of figuring out which assets get inflated. This time around gold is not the only beneficiary, stocks are, too, and I’m convinced that the chart below holds the key to the end of the bull market. Words: 475; Charts: 1
5. QE Could Drive S&P 500 UP 25% in 2013 & UP Another 28% in 2014 – Here’s Why

Ever since the Dow broke the 14,000 mark and the S&P broke the 1,500 mark, even in the face of a shrinking GDP print, a lot of investors and commentators have been anxious. Some are proclaiming a rocket ride to the moon as bond money now rotates into stocks….[while] others are ringing the warning bell that this may be the beginning of the end, and a correction is likely coming. I find it a bit surprising, however, that no one is talking of the single largest driver for stocks in the past 4 years – massive monetary base expansion by the Fed. (This article does just that and concludes that the S&P 500 could well see a year end number of 1872 (+25%) and, realistically, another 28% increase in 2014 to 2387 which would represent a 60% increase from today’s level.) Words: 600; Charts: 3