With gold trading Thursday (August 18) at close to $1835/oz, many are asking if gold is in a bubble. While gold may be expensive relative to its price last year, how does it compare with that of the S&P 500 -and, as such, how much higher might we expect gold to go]? Words: 346
So says Plan B Economics (www.planbeconomics.com) in an article* which Lorimer Wilson, editor of www.munKNEE.com (It’s all about Money!), has further edited ([ ]), abridged (…) and reformatted below for the sake of clarity and brevity to ensure a fast and easy read. Please note that this paragraph must be included in any article re-posting to avoid copyright infringement. The article goes on to say:
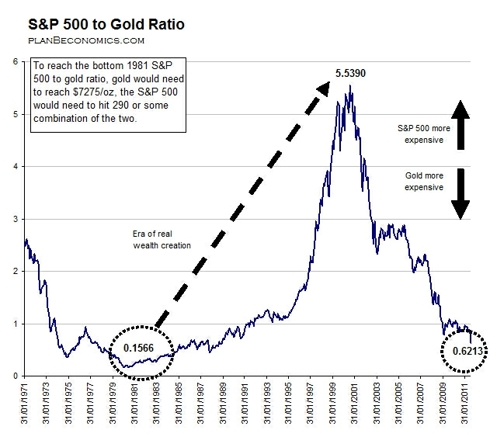
The chart below compares the S&P 500 to gold going back to January 1971. In essence, this ratio represents the inflation-adjusted value of the S&P 500. Higher numbers represent a higher relative value for the S&P 500. Lower numbers indicate a higher relative value for gold.
Throughout this comparison, the lowest S&P 500-to-gold ratio was 0.1566 back in 1981. Using this as a peak relative value for gold, we can analyze today’s gold price.
Conclusion
Today’s S&P 500-to-gold ratio has not yet fallen to its historical low of 0.1566. To reach historical lows set in 1981, the S&P 500 would either need to fall to 290, gold would need to rise to $7275/oz or some combination of the two would have to occur.
*http://www.planbeconomics.com/2011/08/19/could-gold-hit-7250/
Who in the world is currently reading this article along with you? Click here to find out.
Related Articles:
Editor’s Note:
The above article consists of reformatted edited excerpts from the original for the sake of brevity, clarity and to ensure a fast and easy read. The author’s views and conclusions are unaltered.
Permission to reprint in whole or in part is gladly granted, provided full credit is given as per paragraph 2 above.
 munKNEE.com Your Key to Making Money
