…Our gold price prediction for the coming years is directionally bullish. Some periods of weakness with gold price pullbacks may be expected… Our gold price targets are as follows:
- 2024: max gold price around $2,600.
- 2025: max gold price right above $3,000.
- 2026: max gold price around $3,900.
- 2030: peak gold price prediction $5,000.
The above prices are estimates produced by InvestingHaven’s research, based on current and predicted intermarket trends and secular gold charts….[To arrive at those prices] we perform genuine analysis based on a methodology we [have] established…[over] the last 15 years…We take a top-down approach… starting with the 50-year gold price chart to understand dominant secular dynamics followed by the gold price chart over 20 years for medium to long term dynamics….
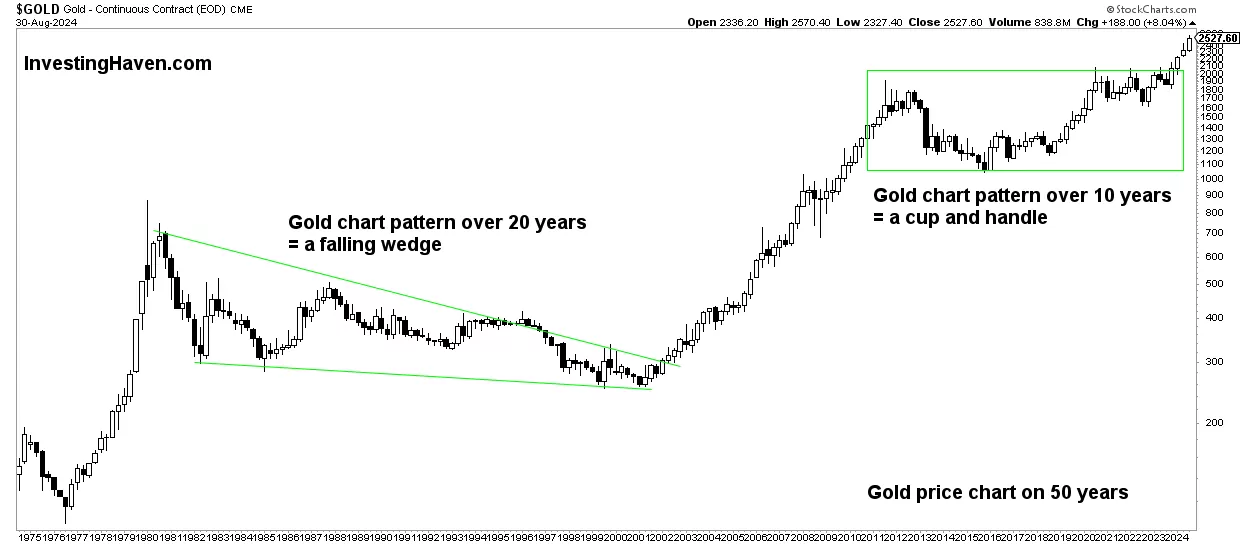
The 50-year Gold Chart
The 50-year gold chart [below]…shows 2 secular bullish reversal patterns:
- Aa long falling wedge in the 80s and 90s …[which] was such a long (hence strong) pattern that the subsequent bull market was unusually long and
- a secular cup and handle formation between 2013 and 2023.
As I said: ‘long’ equals ‘strong’ when it comes to consolidations and reversal pattern and this creates a strong argument for a strong gold bull market in the years to come, with a high confidence level.
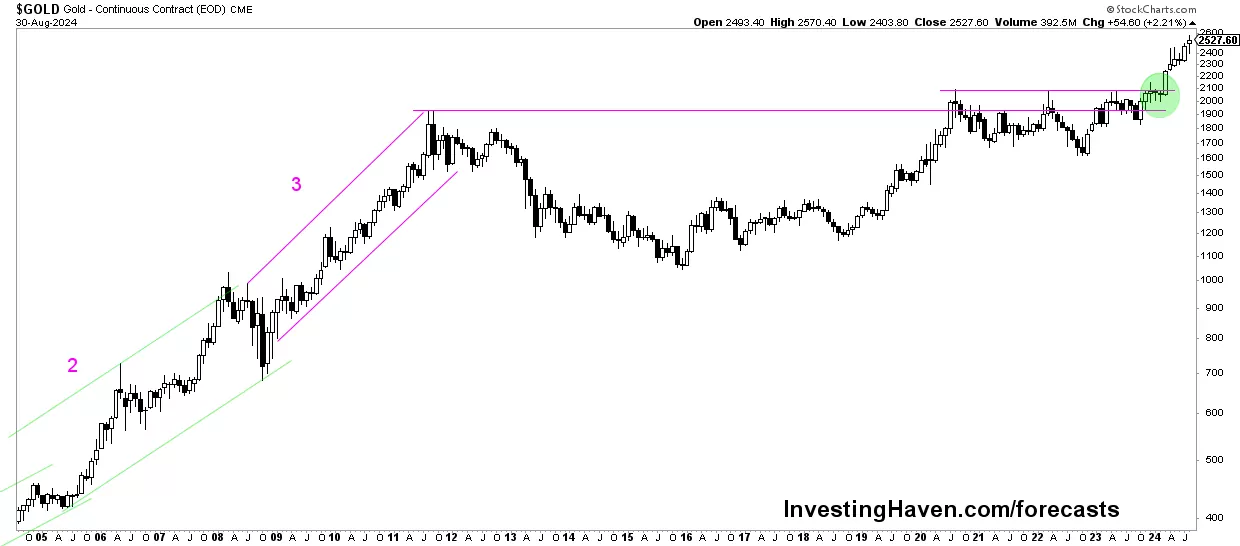
A look at the 20-year…[gold chart below shows that]:
- A gold bull market tends to start slowly and accelerate towards the end and
- the last gold bull market experienced three phases and, given the bullish cup and handle reversal between 2013 and 2023, we can reasonably expect a multi-staged gold bull market going forward.
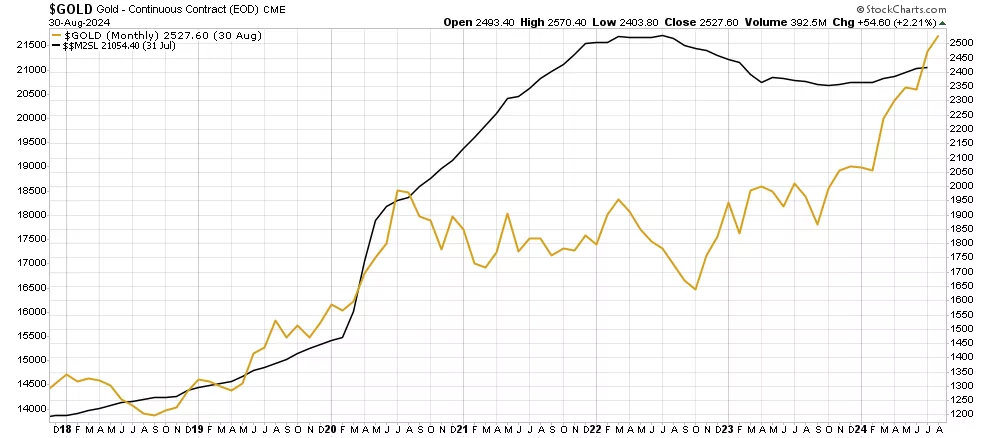
Monetary Growth
As seen on below chart, the monetary base M2 continued its steep rise in 2021…[before starting to stagnate] in 2022….[as] the divergence between M2 and the gold price was not sustainable….
The CPI (inflation)
[As can be seen in the chart below] the divergence between CPI and the price of gold was temporary…[but] we expect both CPI and the gold price to rise in synch in the coming years, driving a soft price uptrend in 2025 and 2026.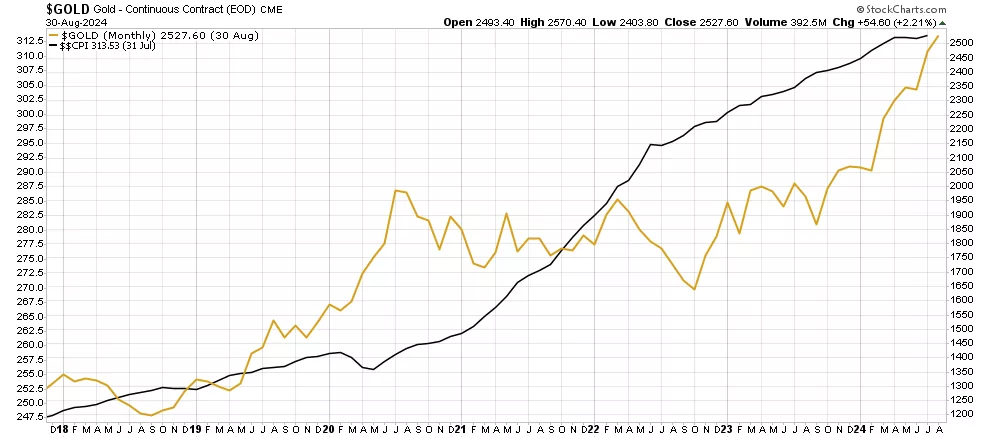
Inflation Expectations
…Many analysts believe that the fundamentals of gold are related to supply/demand dynamics, economic outlook, recessions, and the likes [but] we thoroughly disagree. Our research has shown that inflation expectations is THE fundamental driver of gold and, consequently, the fundamental analysis of gold is based on inflation expectations (TIP ETF)….Essentially, the chart below says it all – inflation expectations [are] moving in a long term channel which supports higher gold & silver prices
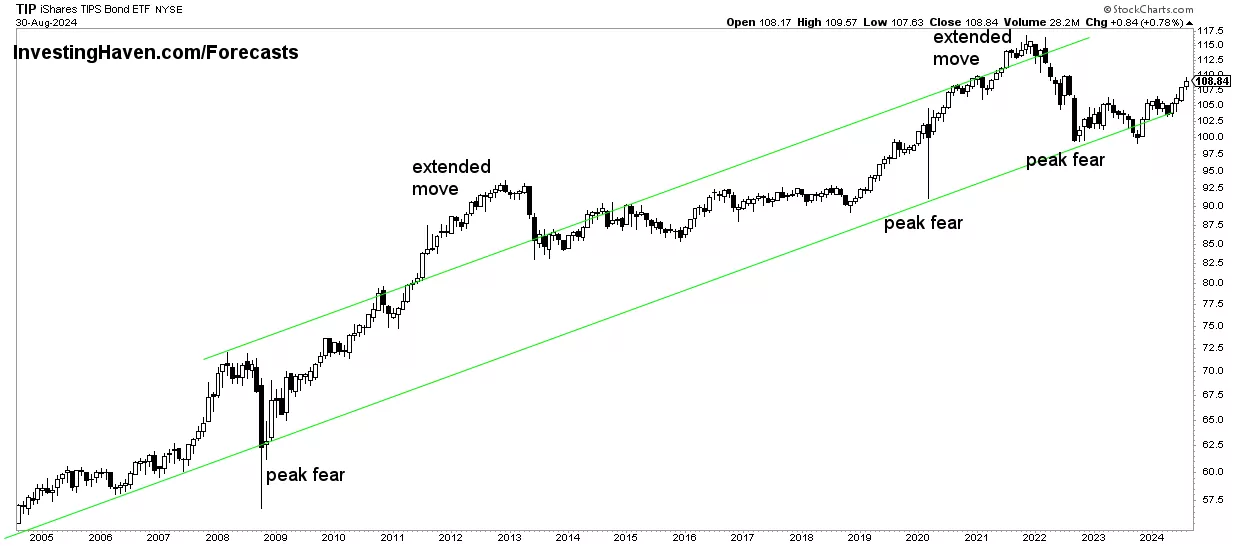 The TIP
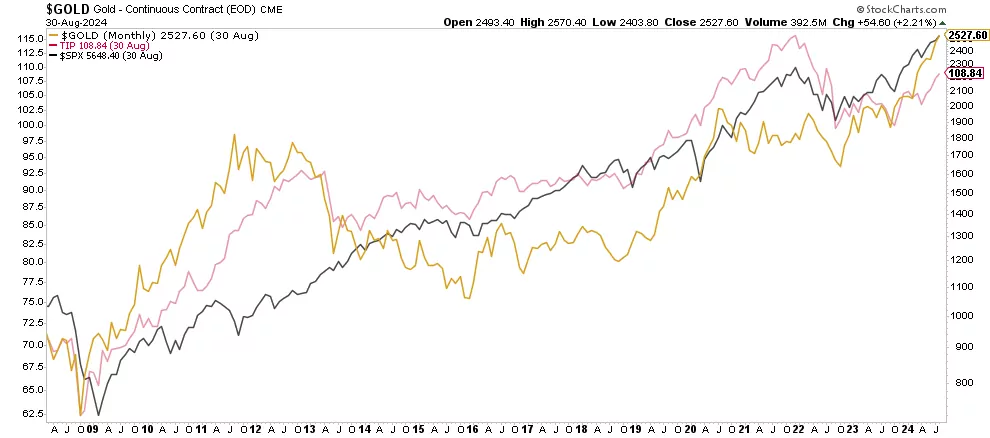
Historically, the price of…gold is strongly correlated with the TIP ETF which is strongly correlated with SPX…so, the thesis that gold thrives well during a recession is FALSE [as the chart below illustrates].
 Currency and Credit Markets
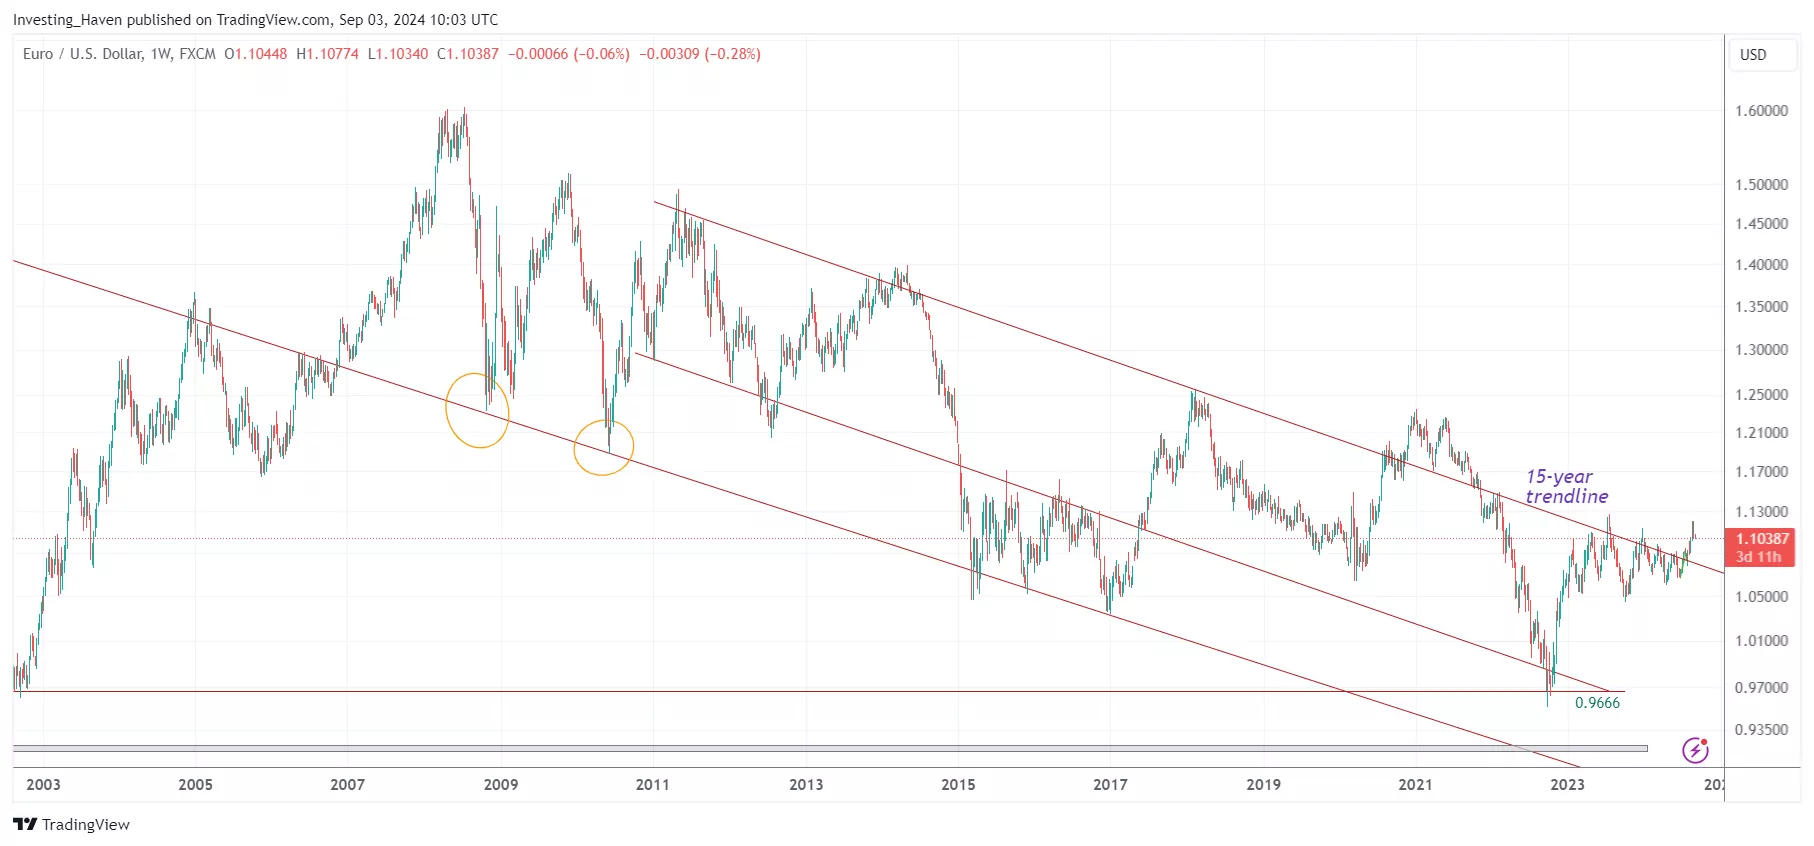
One of the two leading indicators for the price of gold price is an inter-market dynamic driven by currency and credit markets. In particular, gold is correlated to:
- The Euro (inversely correlated to the USD) and
- bond prices (positively correlated most of the times, not always though).
Gold tends to go up when the Euro is in a bullish mindset. Consequently, when the USD is rising it puts pressure on gold. [Currently] the EURUSD looks pretty strong…[as seen in the chart below and] this creates a gold-friendly environment.
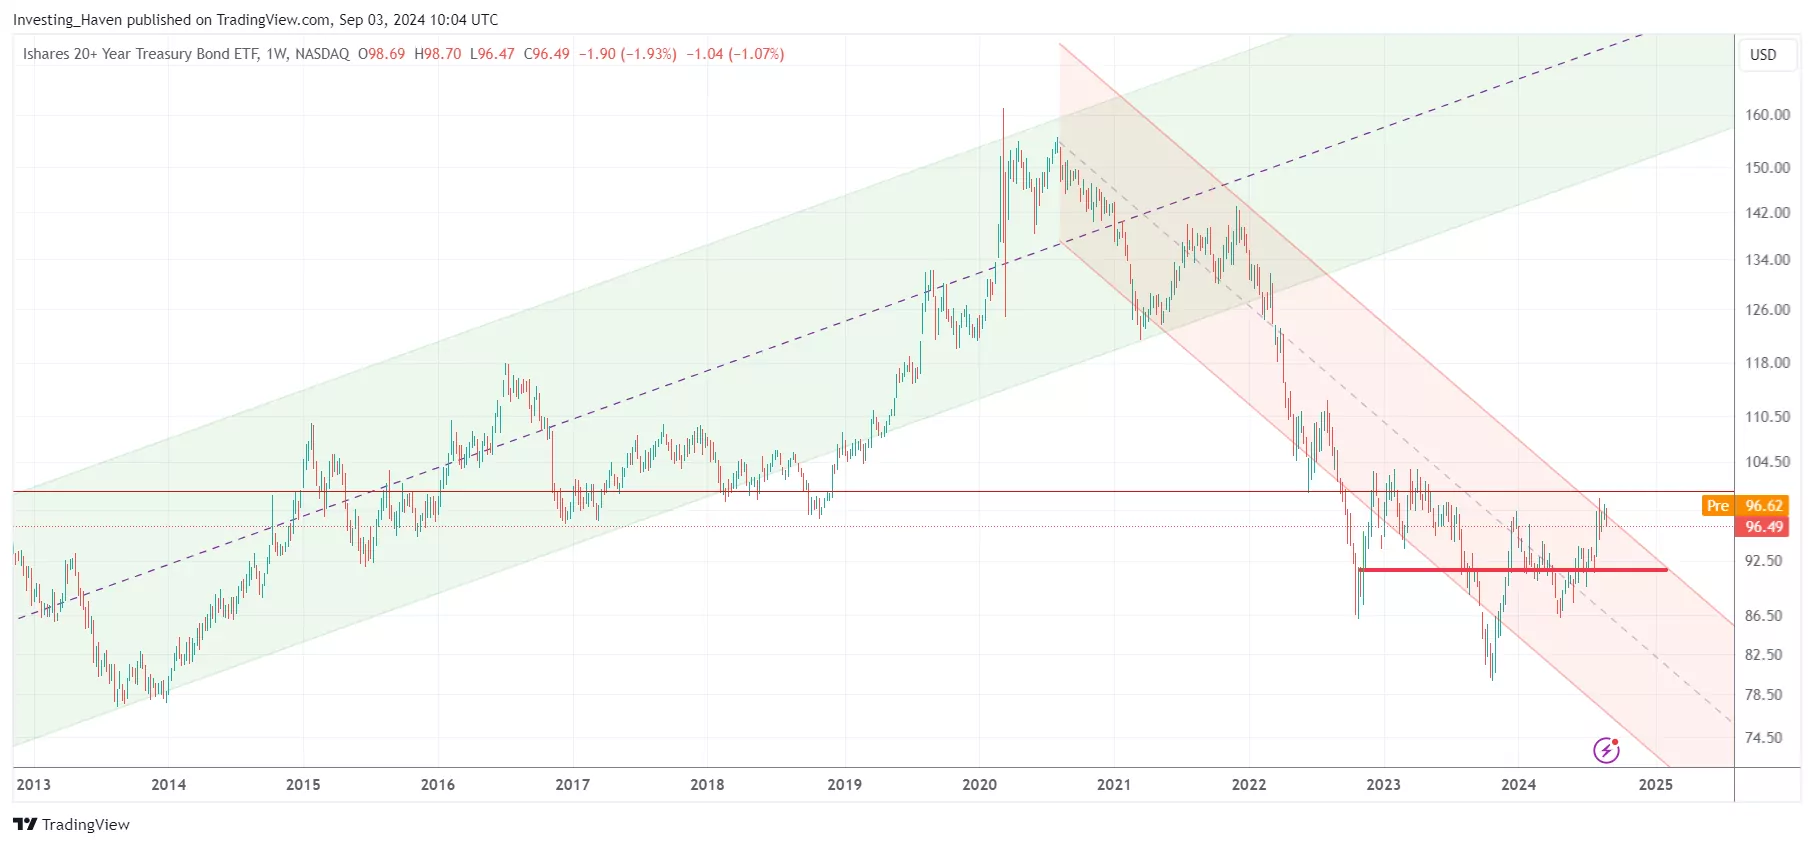
 Treasuries
Treasuries are positively correlated to gold, bond yields are inversely correlated to gold and that’s because of the effect of changes in yields on the net inflation rate.
As seen, below, on the weekly chart of 20-year Treasuries, gold was able to rise after Treasuries bottom (rates peaked) mid-2023 and, with the prospects of rate cuts all over the world, it is expected that Yields will not move higher. This is supportive for gold.
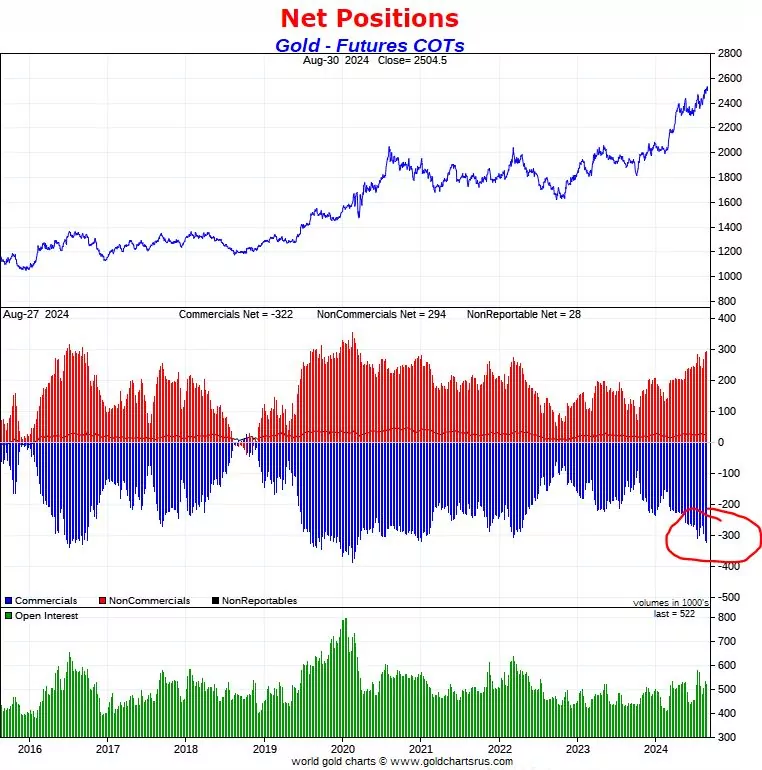
 Futures Market
The way to read this next chart is a follows:
- The first pane shows the gold price over 9 years.
- The center pane features net long positions of non-commercials in blue. Red bars represent net short positions of commercials.
We think of the net short positions of commercials as a ‘stretch indicator’. If those positions are very low, the price of gold cannot be ‘suppressed’ too much. Conversely, if those positions are ‘stretched’ (high), the price of gold has not a lot of upside and/or it cannot rise fast.
Conclusion
The above gold charts and gold’s leading indicators confirm that gold will continue its steady rise in the coming years…
The above post is an edited ([ ]) and abridged (…) of the original article by Taki Tsaklanos of Investinghaven.com for the sake of clarity and brevity to ensure a fast and easy read.