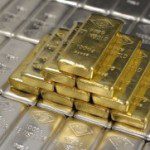
The correlation between the gold price, silver price and the debt growth has been amazingly accurate since 2001. Government spends too much money to perform a few essential services and to buy votes, wars, and welfare, and thereby increases its debt almost every year, while gold and silver prices, on average, match the increases in accumulated national debt.
The above are edited excerpts by Gary Christenson (deviantinvestor.com) from his original article* entitled Gold And Silver Price Projection Based On US Debt Growth.
[The following article is presented by Lorimer Wilson, editor of www.munKNEE.com and the FREE Market Intelligence Report newsletter (sample here) and may have been edited ([ ]), abridged (…) and/or reformatted (some sub-titles and bold/italics emphases) for the sake of clarity and brevity to ensure a fast and easy read. This paragraph must be included in any article re-posting to avoid copyright infringement.]
Christenson goes on to say in further edited excerpts:
The disconnect in the correlation this past spring is difficult to explain in the midst of an epic rush for physical gold driven by the Eastern hemisphere apart from the fact there is a disconnect between the needs of institutional investors (which focus on trading in the futures markets) versus the needs of ordinary people and small investors (looking to preserve their capital as their cost of living is rising at another rate than the official CPI).
With recent evolutions, including the US central bank withdrawing their tapering plans, the rise of the debt ceiling and U.S. debt value surpassing 17 trillion dollar, gold seems to be steadily reacting again in line with its “expected” correlation…]Were] this correlation to hold, what would the gold and silver price be five years from now? Given the rate of growth of the debt, it becomes an easy exercise of math. Mind the underlying assumption though.
Correlation between Gold, Silver, and National Debt
Examine the following graph. It is a graph of smoothed* annual gold and silver prices (by taking monthly closing prices and calculating a 24 month simple moving average. Annual prices graphed are the average of the 12 average monthly prices per year) and the official U.S. national debt since 1971 when the dollar lost all gold backing and was “temporarily” allowed to float against all other un-backed debt based currencies. All values start at 1.0 in 1971. Dashed lines indicate guesses for the future normalized values for gold, silver, and the national debt.

…[Given that] our 435 representatives, 100 senators, and the administration listened to their corporate backers and
- chose to increase the debt ceiling,
- continue spending as usual,
- not “rock the boat,” and
- carry on with the serious business of politics and payoffs for another three months
Furthermore, like the national debt, both gold and silver (and probably most consumer prices) will increase substantially from here, until some traumatic “reset” occurs. What sort of reset?
- A “black swan” event that is unpredictable, by definition.
- Middle East war escalation.
- Derivative melt-down.
- A dollar collapse when foreigners say “enough” to the dollar debasement policies pursued by the Fed and the US government.
- A collapse of the Euro or Yen for any number of reasons.
- A banker admits that most of the official gold supposedly held in New York, London, and Fort Knox is gone and has been sold to China, India, and Russia.
- You name the false flag operation.
My guess: Gold and silver prices will rise gradually for a while, and then quite rapidly after one of the above “financial icebergs” smashes into our “Titanic” world monetary system.
[As I believe that] we will have difficulty locating physical gold available for sale after such an event occurs, even at much higher prices, now would be a good time to purchase physical gold and silver for storage in a secure storage facility. Paper gold will not be safe.Congress has acted. The President has spoken. The Federal Reserve will continue “printing” dollars to increase banker profitability, fund the government, and fight the forces of deflation. This is business as usual – as it has been for the past 42 years.
[Editor’s Note: The author’s views and conclusions in the above article are unaltered and no personal comments have been included to maintain the integrity of the original post. Furthermore, the views, conclusions and any recommendations offered in this article are not to be construed as an endorsement of such by the editor.]
*http://www.deviantinvestor.com/5114/5114/ (Copyright © 2013 – All Rights Reserved – Deviant Investor)
Related Articles:
1. Continued Growth In U.S. Public Debt Suggests $2,000 Gold – Here’s Why
The price of gold, on a quarterly basis, is 86% correlated – yes, 86%! – to total government debt going back to 1975… and a shocking 98% over the past 15 years!. Despite the current rumblings, everyone is aware that the debt ceiling will be raised and will likely surpass $20 trillion by the end of President Obama’s term. That would put the price of gold at about $2,000 per ounce. Read More »
 munKNEE.com Your Key to Making Money


Fascinating blog! Is your theme custom made or did you download it from somewhere?
A design like yours with a few simple tweeks would really make my blog stand out.
Please let me know where you got your design. Appreciate
it
Yes, I agree PM’s are going to start setting ever higher record prices as flat money becomes too volatile in most Countries…
+
I believe that Silver will follow in the footsteps of Gold then start leading the way as both PM’s start zooming upward…