Martin Armstrong, considered to be one of the best – if not the best – market prognosticator in history, had maintained until recently that the price of gold would correct sideways to down into the next bottom of his Economic Confidence Model into June 13, 2011. In a new article that appears to be an apparent response to a recent editorial* I wrote he seems to have changed his position somewhat. Let me explain. Words: 1979
So says Goldrunner (www.GoldrunnerFractalAnalysis.com) in an article* which Lorimer Wilson, editor of www.munKNEE.com, has reformatted and edited below for the sake of clarity and brevity to ensure a fast and easy read. (Please note that this paragraph must be included in any article re-posting to avoid copyright infringement.)
Goldrunner goes on to say:
(The material below is only a small condensed version of what I will be posting for subscribers to my site where we are currently in the process of building content. If you have any questions about our new site, I can be reached at the e-mail address listed, below.)
My Thoughts in February
In an editorial* in February I showed that Gold rose aggressively up into each of the Economic Confidence Model’s last two bottoms with the price of Gold actually bottoming right at each period’s Model top which was the exact opposite of my fractal work off of the late 70’s Gold chart which shows that Gold will rise into mid-year. You will find a chart near the end of the article which shows this in graphic form.
Mr. Armstrong’s New Comments
Armstrong’s new article now shows an openness to the possibility of higher Gold prices in the near term although he expects to see a bottom in Gold from some level into June….In addition, he also notes the potential for Gold to rise up to the $12,000 level which is the high end of the potential range I have consistently maintained since 2009 based on the fractal relationship of the Gold:Dow ratio as seen in the 1970’s Gold Bull Market.
In his new article Mr. Armstrong clearly states that one cannot compare any single market including Gold to his Model- that his model provides timing such that any single market that bottoms when his Model bottoms tends to do well going forward. He also states that if Gold were to break too far to the upside above his stated price points, as is the case now, then Gold would be going through a “phase transition” where Gold might rise to a point that prevents the future price of Gold from reaching his higher potentials unless Gold trades down into his Model’s bottom into June 13th. He does open up the possibility that Gold could trade higher and still correct down into his Model’s bottom from a higher level. These are generalized statements as I read them so I would strongly suggest that you read his new article on Gold for yourself. There is no doubt that Mr. Armstrong is brilliant, yet those of us who are less gifted need to find the best way we can to frame-up the investment environment going forward using all of the investing reference points we can find.
Fractal Relationships in Review
Back in 2002 my work with technical analysis involving the charts of the Precious Metals Sector led me to consider the fractal nature of the long-term chart of Gold. Eventually, in early 2009 I read my first Martin Armstrong article that was named “It’s Only Time.” I was pleasantly surprised to read that Mr. Armstrong’s very successful market work was based on fractal relationships. If memory serves, I think he described his point of realization of the fractal nature of the markets by noting his observation that he would see “price patterns repeat in first the daily chart, then the weekly chart, and then the monthly chart.” I thought this was a wonderful way to express the fractal nature of how price patterns repeat over time.
In his new article Mr. Armstrong seems to suggest that the “when”, or time component, of a cycle can be scientifically determined yet the “how”, or the price pattern that forms, can only be foreseen based on subjective analysis and the level of experience of the operator. If so, then what happened to the concept of fractal patterns repeating in similar form in the daily, then the weekly, then the monthly charts? The fractal work that I do with the current Gold Bull off of the 1970’s Gold Bull has seen nicely recurring price patterns off of the late 70’s Gold Bull Chart, and the pattern at this point suggests a strong rise in Gold into mid-year.
Gold’s Relationship to Armstrong’s Economic Confidence Model
In Armstrong’s new article he suggests that Gold can only reach his potential target of $12,000 if Gold trades down into his Model’s bottom into June so that Gold will be in sync with his Model. This comment gives me pause. He states that the real problem, today, is the huge level of debt. This certainly makes sense. The huge deflationary backdrop of debt which continues to rise forces the Fed to accelerate the Inflation of the US Dollar. As the US Dollar is devalued, the US debt is also devalued since the US debt is fixed in price and denominated in US Dollars. The form of Dollar Inflation, today, is debt monetization in the form of QE. This type of Dollar Inflation does not directly increase the amount of newly printed Dollars reaching the economy so the economy continues to deteriorate generating the need for more US Debt and even more Dollar Inflation. The falling value of the US Dollar drives the price of Gold in the US Dollar higher, though higher in lesser valued Dollars.
If the above is true, then I would expect Gold to trade inversely to the Economic Confidence Model and to rise as the continuing deterioration of the economy generates the need for more Dollar Inflation. In fact, this is true for most nations who are now simultaneously devaluing their paper currencies, creating a period of Global Competitive Currency Devaluation (GCCD). Doesn’t this world-wide condition create Capital flows into Gold across the world attracting hot paper money to Real Money Gold as the world-wide economy continues to deteriorate? If so, then don’t world-wide Capital flows into Real Money Gold tend to move opposite the cycle of world-wide Economic Confidence? If so, I cannot see Gold moving in lockstep with the Economic Confidence Model in this GCCD environment but, rather, would expect Gold to trade inversely to the Model.
I think Armstrong’s above quote is unfortunate. This comment might be seen as a slight to everyone investing in Gold, Silver, and the Precious Metals Stocks at this time. This comment is especially interesting in the light of his new, higher price target for Gold being offered – one potentially up to $12,000 an ounce for the current Gold Bull. Investors are rushing into anything with intrinsic value these days. Don’t we have “copper bugs”, and “corn bugs”, and cotton bugs”, too? This is what makes a market – different investors looking for different price movements at different times.
The bottom line to me is that the price of Gold rises directly proportional to the rise in Dollar Inflation that devalues the US Dollar. The true revaluation of Gold, higher, is created by investor demand for Gold as paper chases Real Money. So, what difference does it make in the end whether investors vote for a higher Gold price, today, or after June 13th? The decisions made by investors create the market and, as Mr. Armstrong has reminded us in his latest article, “The market is never wrong.” Ironically, I do think that it does make a difference in this case since the parabolic price movement of Gold represents the collective parabolic change in psychology of the people moving to buy Gold.
The above being said I believe Mr. Armstrong has simply been the best with the markets for many years. I certainly wish him all of the best into the future.
Some Final Insights
A period of aggressive US Dollar inflation turns many things on their head since “price and value diverge” in this environment as the value of the Dollar drops. This becomes a world-wide phenomenon in the rare instance when paper currencies all over the world are simultaneously being aggressively inflated and devalued. The huge debt at all levels of government, and in the economy, left only two choices as we entered K-Winter: either the debt levels collapse into a deflationary heap, or the Fed aggressively inflate the US Dollar. I am sure that it was a difficult decision for those in charge who became responsible for the indiscriminate spending piled up over many decades. The program of Dollar Inflation still has a long way to go considering the sad “state of the States” and the huge unfunded liabilities that remain in the system. Some say that the markets are discounting mechanisms as investors start to recognize what the future will bring. If so, then I suspect we will see a sharp rise in Gold, sooner rather than later, as an increasing number of investors turn to Gold as it climbs up its parabolic path.
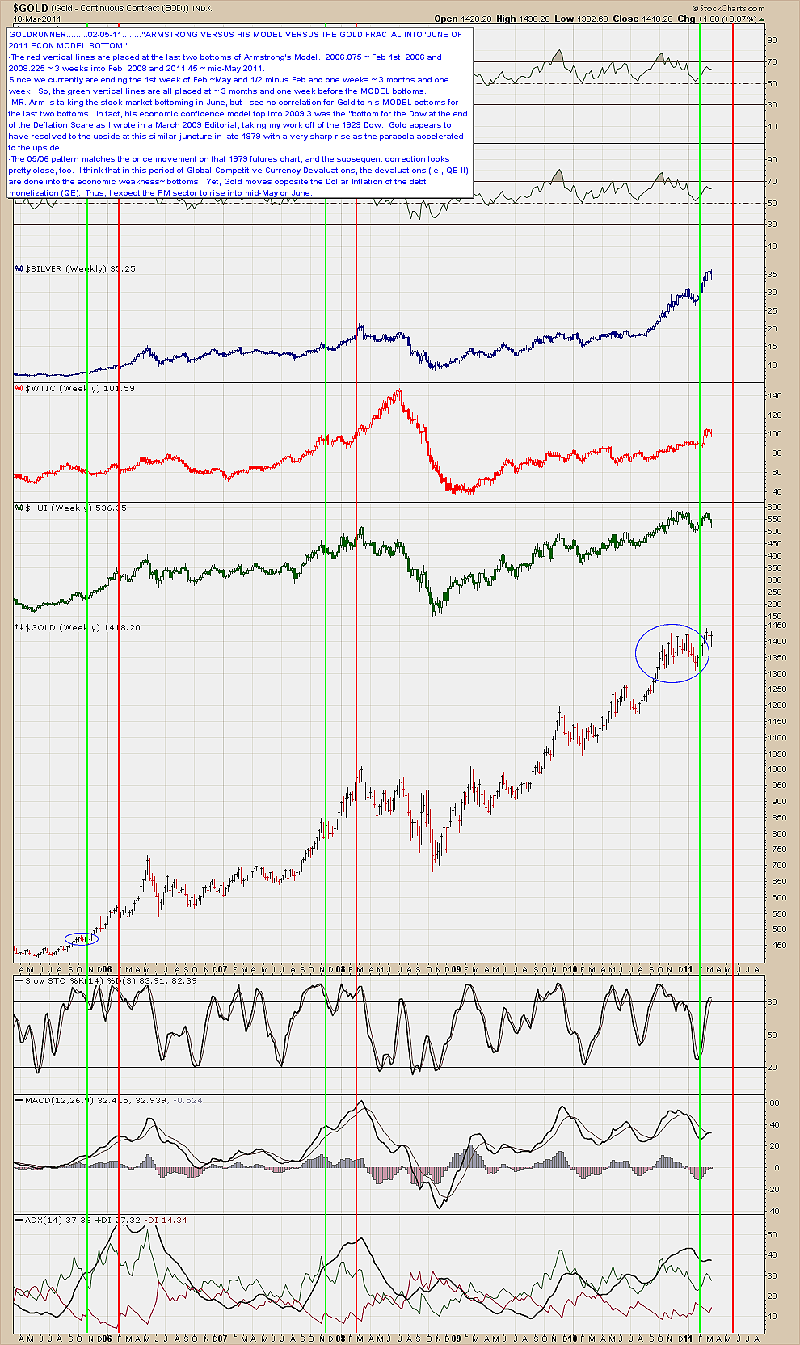
Fractal Gold vs. Armstrong’s Economic Confidence Model
The green lines on the chart below represent “Economic Model Tops” while the red lines represent “Model Bottoms.” I have placed the red line in the current time period in the middle of May which represents the 2011.45 date on Mr. Armstrong’s Model – although he states that date as coming on June 13th. The time to the Model bottom might be longer than the chart represents.
At this time Gold is rising similarly to what we saw at the previous two periods. A rise into mid-year would match the fractal work I do off of the 79 Gold Bull Chart.
Current Log Chart of Gold
Notice that in the 2005/ 2006 fractal time-frame chart below how Gold moved higher. This is the analogous time-frame to the Model Chart, above. We can see that in the 2005/ 2006 time frame Gold launched higher from the same angled black dotted line where Gold has recently found support.
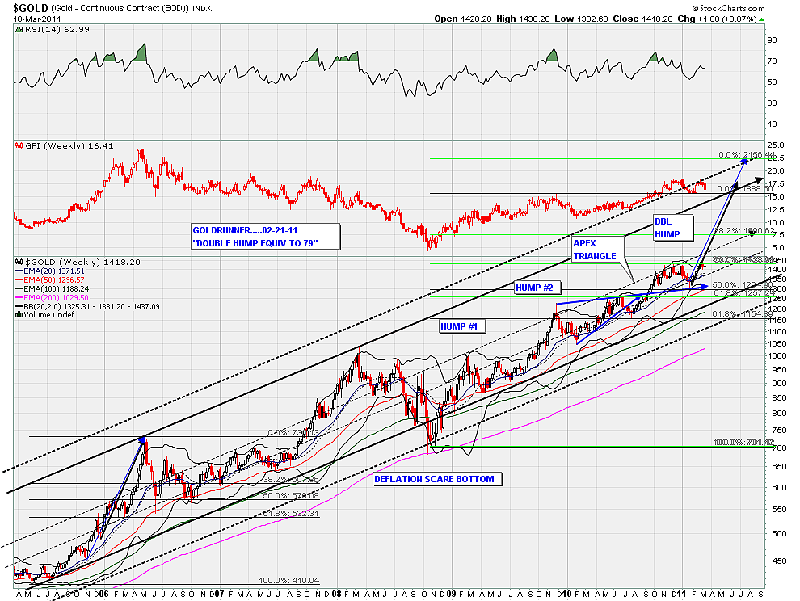
An analogous rise in Gold at this time could see Gold rising up to the black line at around $1860 with the possibility that Gold could overshoot that line to the higher dotted line target. I am expecting Gold to move higher very soon with the PM stock indices following suit similar to the move we saw back in 2005/ 2006.
Please note that the above comments are a matter of opinion and is not intended as investment advice. Information and analysis above are derived from sources and utilizing methods believed reliable, but we cannot accept responsibility for any trading losses you may incur as a result of this analysis. Comments within the text should not be construed as specific recommendations to buy or sell securities. Individuals should consult with their broker and personal financial advisors before engaging in any trading activities. Do your own due diligence regarding personal investment decisions. In the interest of full disclosure, GOLDRUNNER is personally invested in the Precious Metals sector including various Precious Metals and other individual stocks. GOLDRUNNER reserves the right to modify or eliminate any or all positions at any point in time.
For the moment…………………GOLDRUNNER44@AOL.COM
* (see here and here)
- The above article consists of reformatted edited excerpts from the original for the sake of brevity, clarity and to ensure a fast and easy read. The author’s views and conclusions are unaltered.
- Permission to reprint in whole or in part is gladly granted, provided full credit is given as per paragraph 2 above.
- Sign up to receive every article posted via Twitter, Facebook, RSS feed or our FREE Weekly Newsletter.
Gold