The Gold/Housing ratio…has an interesting historical track record for identifying turning points in long-term gold price trends and, In light of the commodities rout occurring in the summer of 2015, and the continuing strength in housing, it is worthwhile revisiting this basic measure, because the results aren’t at all what most people likely think they are.
The above edited excerpts, and what follows, are taken from an article* by Daniel R. Amerman (DanielAmerman.com) originally entitled The Gold/Housing Ratio As A Valuation Indicator which can be read in its entirety HERE.
The Historical Gold/Housing Ratio
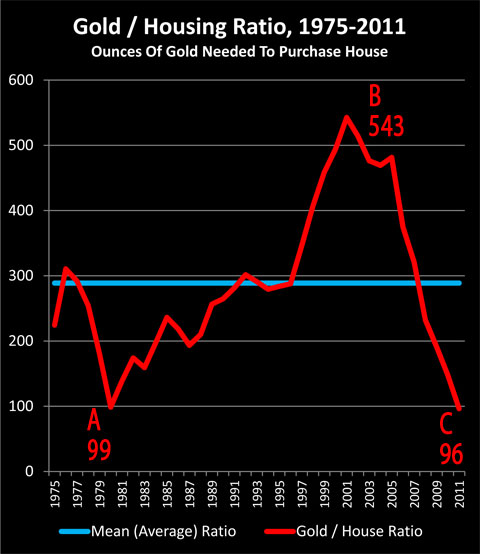
The graph below shows the Gold/Housing ratio for the modern era in the United States, from when gold investment was legalized on December 31, 1974 through November of 2011.

The information provided by the Gold/Housing ratio in 2015 is not as extreme an outlier as it was in 2011, but it is nonetheless compelling – and may be surprising. Indeed, this long-term measure flat-out contradicts many widely held perceptions about market valuations today.
Understanding the Gold/Housing Ratio
The Gold/Housing ratio is a measure of relative value between gold and real estate. It is the number of ounces of gold required to purchase an average single family home in the United States.
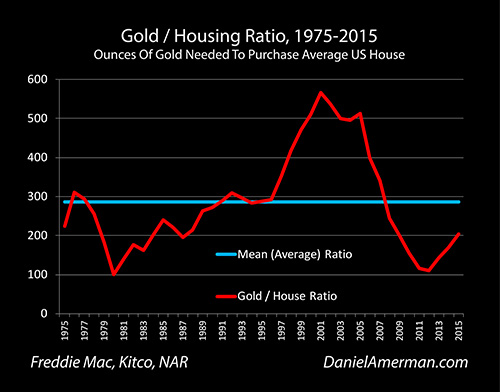
When we take the $221,314 current median national price for an existing single family home [nationwide, the median price of existing homes is $236,400 as the National Association of Realtors sees it.] and divide it by the $1,089 price per ounce of gold as of July 22, 2015, we come up with a Gold/Housing ratio of 203, meaning it takes 203 ounces of gold to purchase an average single family home.
Making Use of the Gold/Housing Ratio
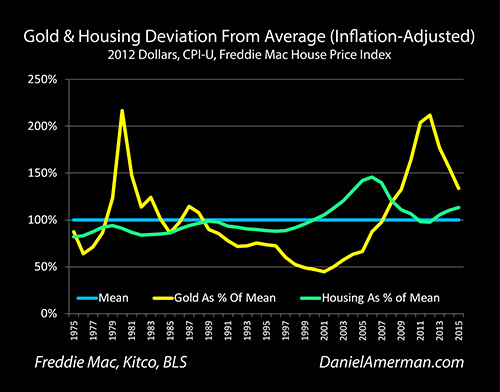
People often buy gold and real estate as alternative investments, either because they are seeking fundamental diversification from financial assets such as stocks and bonds, or they are concerned about inflation. However, while real estate and gold are each tangible assets and can be powerful inflation hedges – they don’t tend to move together in real terms. This can be clearly seen when we adjust historical prices for inflation, as shown below. Both investments do oscillate up and down around long term averages over the 40 years, but they so in quite different cycles, with their peaks and valleys occurring in different years.

If you can buy gold “cheap” while real estate is relatively “expensive”, then on an asset price basis over the long term, gold is likely to strongly outperform real estate as an investment, all else being equal – and vice versa – but what exactly is “cheap” and what is “expensive”? Answering that question is where the Gold/Housing ratio is quite useful. As there is no dollar component in the ratio itself, inflation index and measurement concerns drop out, and we are left with the value of two of the most popular tangible investments relative to each other.
The long-term average is represented by the blue line in the graphic below. Over the 40 years that gold has been a legal investment in the modern United States, it has taken an average of 286 ounces of gold to purchase an average single family home, meaning the current price of 203 ounces is equal to 71% of the long term average.

Current Gold/Housing Ratio Implications
The long-term average for the Gold/Housing ratio is 286 ounces to buy a house, and the current ratio is 203 ounces to buy a house. This would indicate that gold is overvalued by 41% relative to average single family residence prices in the United States, even with a $1,089 per ounce price for gold.
Yes, gold has been plunging. Yes, real estate has been steadily climbing. Yes, the ratio has doubled since then – but it needs to almost triple before historical averages are achieved.
Indeed, real estate is in the unusual place right now where both short-term trend followers and contrarians holding a long-term investment perspective might identify it as being a buy. For those who are drawn to rising prices – we are three years into a trend line of rising prices. For those seeking value pricing, and to buy in at prices below the long-term averages – real estate is still quite attractively priced relative to gold.
Whether one wants to think of housing being undervalued relative to gold, or gold being overvalued relative to housing, either way – that is clearly the current situation, and it is not even close on a national basis when compared to long-term averages.
Conclusion
The above means that all else being equal, over a long enough period, an investment in housing will more likely than not outperform an investment in gold – possibly by a substantial margin – assuming that each investment tends to revert to the mean (i.e. return to average valuations) over time in the future, as they have in the past.
In a long-term strategy which employs both investments, unless one is specifically investing for financial crisis, there is a case for putting an over-weight on housing, and an under-weight on gold, given current relative price levels.
*http://danielamerman.com/va/GHratio.html
Related Articles from the munKNEE Vault:
1. Which is a Better Long-term Value – Current House Prices or Current Price of Gold?
When real estate is “cheap” and gold is “expensive”, relative to their long-term averages and each other, real estate is likely to powerfully outperform gold as an investment and inflation hedge over the long term, all else being equal. [That being said, however,] what exactly is “cheap” and what is “expensive”? Answering that question is where the Gold / Housing ratio comes into play. [Let’s take a look at it and determine whether gold or real estate is a buy at the current time.] Words: 3516
 munKNEE.com Your Key to Making Money