With what is happening in the price of gold these past few weeks/months it is imperative to take a look at the big picture and in doing so it shows that we are still very much in a long-term bull market. Let’s take a look at some charts that clearly outline where we are currently and where we could well be going. Words: 925
So says Lorimer Wilson, editor of www.munKNEE.com (Your Key to Making Money!). Please note that this paragraph must be included in any article reposting with a link* to the article source to avoid copyright infringement.
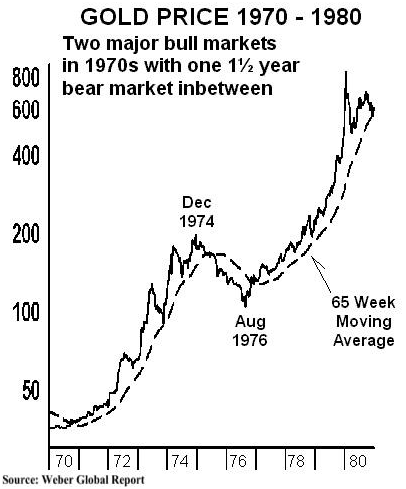
As the graph below shows, the 70s experienced 2 major bull markets and an 18 month bear market in between while continuing to trend upwards.

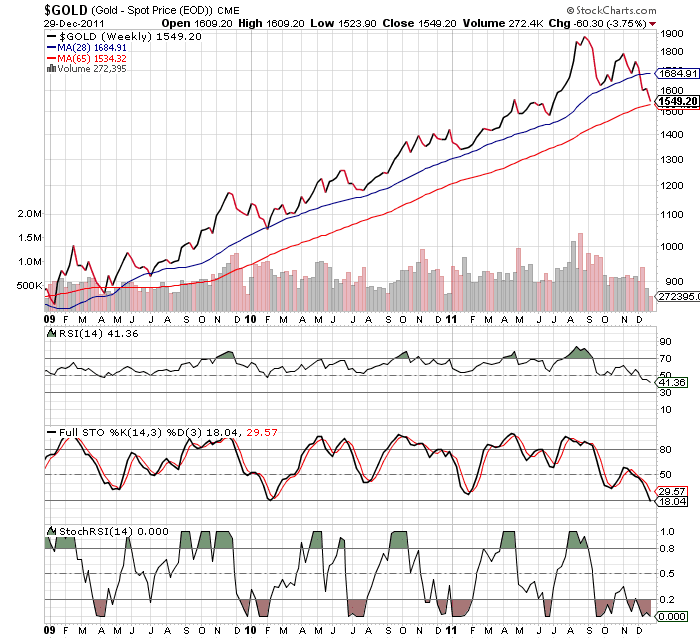
Right now, we are at a period not unlike late 1976 when gold had bottomed just before taking off in a parabolic move. Gold dropped to $1,549 on December 29th slightly above its 65 week moving average as seen in the chart below and has since bounced upwards as suggested would happen by analysts such as Goldrunner who, deploying fractal analysis, wrote in his recent article Goldrunner: Gold On the Cusp of $3,000+.
Alf Field gave a speech recently at the Sydney Gold Symposium in which he confirmed his projection, using Elliott Wave Theory, that gold will reach a parabolic peak of $4,500 (no specific time frame given) with two 13% corrections along the way. I took excerpts from his speech and put it into an article entitled Alf Field: Gold Going to $4,500/ozt. in Next Wave Towards Parabolic Peak.
Arnold Bock has consistently maintained for the past year and a half that gold would go parabolic sometime in 2012 and certainly no later than 2013 as can be read in his updated article $10,000 Gold is Coming in 2012/13! Here’s Why.
Conclusion
It is obvious from the charts above that gold has undergone a deeply discounted year-end sale and, as such, provides an ideal opportunity to get in before it renews its trend upwards with a vengence. As to specifically when you should pull the trigger please refer to my article Momentum Trading Generated a 40% Return for Gold in 2011! Here’s How on the application of momentum indicators for insights on how to assess the ups and downs of the markets in general and gold in particular.
*https://munknee.com/2011/12/gold-bounce-confirms-bull-market-intact-on-its-way-to-3000-10000/
Sign-up for Automatic Receipt of Articles in your Inbox or via
FACEBOOK | and/or
TWITTERso as not to miss any of the best financial articles on the internet edited for clarity and brevity to ensure you a fast an easy read.
Related Articles:
1. Don’t Look a Gift Horse in the Mouth – Buy Gold Now With Both Hands! Here’s Why
Since the fundamentals still point to gold’s long-term viability… why [are] investors responding by selling gold…? I was always told not to look a gift horse in the mouth… [so] take advantage of the dip. Words: 962
2. Goldrunner: Gold, Silver and HUI Index to Bounce Back to Major Highs by May 2012
With the present major correction in gold, silver and the mining sector it is important to look at the big picture and see what the charts are saying from a technical fractal relationship with what happened back in 1979 when the last truely major bull run occurred. To date the situation is, frankly, no different than it was back then unfolding just as it should. As a result we can expect MAJOR upward price action in physical gold and silver and in their mining (producers, developers, explorers and royalty streamers alike) in the next few months on their way to their respective parabolic peaks in the years ahead. Read on. Words: 1604
3. When This Pullback in Gold is Put into Perspective It’s No Big Deal – Here’s Proof
Daily and monthly gyrations in the price of gold are nothing to fret over…The price will recover and, in time, fetch new highs…Here’s proof. Words: 264
Gold is in a bull market and, [believe it or not,] so are the gold stocks despite their struggle as a group to outperform gold… but [neither] is anywhere close to a bubble, nor the speculative zeal we saw in 2006-2007. Thus, it begs the question” “What lies ahead and when can we expect the initial stages of a bubble?” To figure this out we first need to get an idea of how long the bull market will last and then where we are now based on various indice analyses. [Below I do just that.] Words: 785
 munKNEE.com Your Key to Making Money


