 The market believes that there is more profit to be made in speculation than in new business investment – and speculation is what you get when you weaken the incentives to invest in productive activities for the long haul. In fact, fear and uncertainty are inhibiting growth [- almost everywhere – as shown in graphic form in the 8 charts below]. Words: 1000
So says Scott Grannis (http://scottgrannis.blogspot.com) in edited excerpts from his original article*.
Lorimer Wilson, editor of www.munKNEE.com (Your Key to Making Money!) and www.FinancialArticleSummariesToday.com (A site for sore eyes and inquisitive minds) has further edited ([ ]), abridged (…) and reformatted (some sub-titles and bold/italics emphases) the article below for the sake of clarity and brevity to ensure a fast and easy read. The author’s views and conclusions are unaltered and no personal comments have been included to maintain the integrity of the original article. Please note that this paragraph must be included in any article re-posting to avoid copyright infringement.
Who in the world is currently reading this article along with you? Click here
Grannis goes on to say, in part:
- the economy is growing, but only moderately;
- the value of the dollar is up in the air;
- the risks of a Eurozone implosion are palpable;
- bloated government spending has suffocated economies everywhere, making debt burdens intolerable;
- fiscal policies need to change radically, but the political will to do so seems lacking, and crony capitalism is on vulgar display too often;
- accommodative monetary policy—which seeks to encourage more borrowing—is not a good solution to a situation made bad by an excess of borrowing, and it only weakens confidence in the future value of currencies;
- gold [approaching] $1800;
- wild gyrations in oil prices;
- high-frequency trading;
- widening spreads on Italian and French bonds.
All [of the above] are symptomatic of a market [see the 8 charts] that believes that there is more profit to be made in speculation than in new business investment. Speculation is what you get when you weaken the incentives to invest in productive activities for the long haul. [Below are 8 charts that show that to be the case in graphic form.]
1. U.S. Manufacturing Production
October Industrial and Manufacturing Production came in stronger than expected, but the bigger picture is that industrial output is rising at a moderate 4% rate: nothing to get excited about, but nothing to worry about either.

2. Home Builders Market Index
A survey of home builders’ sentiment ticked up—surprisingly—this month, and this adds some weight to the case that we have seen the worst in the housing market and may be on the cusp of some improvement.

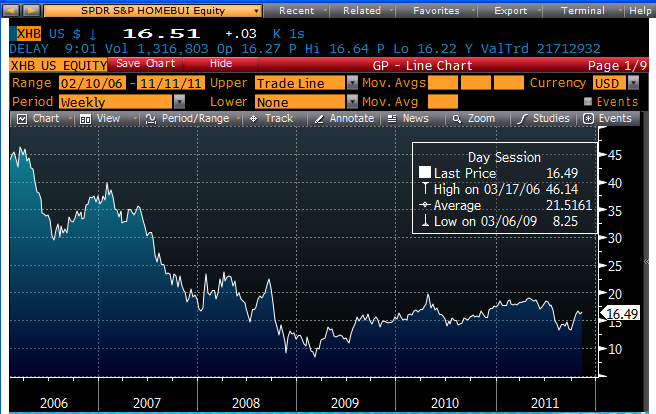
3. Performance of Homebuilders’ Stocks
This next chart, showing an index of homebuilders’ stocks, also suggests we have seen the worse and are seeing some gradual improvement on the margin. Painfully slow, to be sure, but the trend appears to be heading up.
4. U.S. Housing Vacancy Rate
The home vacancy rate also suggests that we have seen the worst and things are improving, although of course there needs to be a whole lot of improvement before we can get back to “normal” conditions.
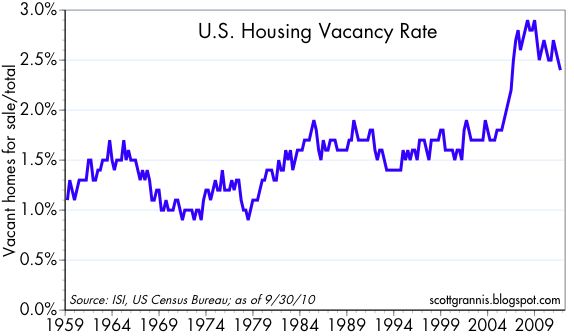
Even though we are still a long way from seeing what might be termed “strength” in the housing market, simply ruling out further weakness is nevertheless quite comforting. As excess housing inventories are worked off and the economy continues to grow and as household formations continue to exceed new construction starts, the case for a rebound in residential construction and a rebound in prices gets stronger.
5. Consumer Price Inflation
October consumer price inflation showed some moderation. On a year-over-year basis, there is nothing alarming going on here. However, declining energy prices have played a big role in moderating overall inflation in recent months, and that is almost surely going to reverse in coming months, since crude oil has now broken above $100/bbl. (up almost 35% from the early October low).

6. Core Inflation to 30-yr. T-bond yields
The following chart compares the yields on 30-yr Treasuries to core inflation. In an ideal world, bond yields would be at least 2 percentage points higher than inflation, and this chart is set up to show that [that] is the case when the two lines are on top of each other.

Reality rarely matches the ideal, of course, but the [above] chart is nevertheless helpful in gauging the valuation of bonds on a real return basis. On that score, in the past several decades, bonds have only been less unattractive at the end of 2008 (not to mention several times back in the rising-inflation 1970s) and considering that core inflation has been trending up while bond yields have declined to very low levels, the real-yield-valuation case for owning long Treasuries is very weak.
Why spend time surfing the internet looking for informative and well-written articles on the health of the economies of the U.S., Canada and Europe; the development and implications of the world’s financial crisis and the various investment opportunities that present themselves related to commodities (gold and silver in particular) and the stock market when we do it for you. We assess hundreds of articles every day, identify the best and then post edited excerpts of them to provide you with a fast and easy read.
Sign up here to begin receiving munKNEE.com’s FREE Financial Intelligence Report
Long bonds are only attractive as an antidote to fear: fear of an implosion in European financial markets that will rock the global economy and deliver us into years of recession or even a global depression. You have to be extremely worried about the future to want to own long Treasuries these days.
7. Core Inflation
The chart [below] compares the year over year growth rate of the consumer and producer price inflation. Both are trending higher, and the PPI seems to be leading the CPI in recent years, suggesting that the rise in the core CPI is likely to continue.

8. Consumer Price Inflation (Ex-energy)
I [have added this next] chart to show some long-term perspective on core inflation. Note the extremely low levels of inflation in the early 1960s, when monetary policy was constrained by the gold standard, the dollar was the king of the hill, and the economy enjoyed very strong growth. Note also how this measure of inflation has crept higher since 2002-3, which was when the Fed first started to ease aggressively and the dollar began to decline.

Conclusion
I don’t think it’s a coincidence that growth has been very disappointing in the past four years. With a weak dollar and very low real interest rates, speculative activity becomes more appealing than investing in the real economy. Business investment is rising, but it is lagging woefully behind the growth in corporate profits.
1. Wise Words of Advice for Today’s Economists from a Veteran Observer


50 economists forecast their estimates for real GDP over the next 6 quarters in a recent Wall Street Journal survey [and their projections, on average, show a modest increase through to the end of 2012 as the table below shows. In addition, they were asked] to forecast… the probability of a recession in the U.S. in the next 12 months] and the results were quite surprising – quite. Let me show you.] Words: 600
3. What is the Primary Reason for Lack of Economic Growth in America? Here is the Answer
The widespread stagnation in wages, rather than the level of unemployment, may offer a better explanation for the failure of economic growth to accelerate two years after the end of the recession. Workers’ ability to negotiate higher earnings won’t return until the job market strengthens, and flagging confidence has raised the risk that consumers may retrench. [Let us explain.] Words: 1018
4. U.S. Economy Won’t Collapse Any Time Soon – Here Are 5 Reasons Why

A good way to think about our country’s economy is to think of the U.S. like a boxer. We were knocked flat on our back in 2008 and have since struggled to one knee but have never got back to our feet. [As such,] those conversations that imply we might be on the verge of falling down again are rather pointless…With this much slack in the economy, it’s unlikely that any economic downturn from here will be substantial. Does that mean I think the U.S. economy can’t contract from here? No, but I would be very surprised if we were to experience another blow similar to the 2008 recession where real GDP fell 5%. [Let me explain.] Words: 538
5. What Decline? U.S Economy Holding Up Exceptionally Well!
