…The cumulative growth of M2 is mind-boggling and very likely to fuel uncomfortably high inflation for the foreseeable future.
This version of the original article by Scott Grannis (scottgrannis.blogspot.com) has been edited [ ] and abridged (…) to provide you with a faster and easier read. Also note that this complete paragraph must be included in any re-posting to avoid copyright infringement.
The growth of the M2 money supply has slowed in recent months (thank goodness!), and yesterday’s FOMC announcement was less aggressive than the market had feared…[but] I still think the Fed and the bond market are behind the curve and, as I point out in this post, the level of M2 is still full of inflationary potential.
M2 Growth Rate
As chart #1 shows below…M2 growth has slowed to an 8% annual rate over the past six months and a 6.2% rate over the past three months. For reference, M2 growth averaged about 6% a year from 1995 through early 2020.
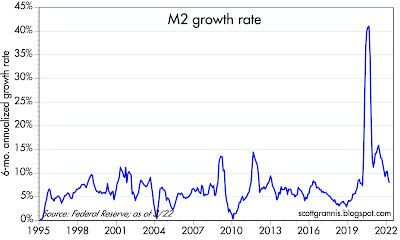
With growth rates back to “normal” is this a reason to cheer? Hardly. If growth hadn’t slowed, that would have been very disturbing; as it is, the cumulative growth of M2 is still mind-boggling and very likely to fuel uncomfortably high inflation for the foreseeable future.
Chart #2 below shows the level of M2 plotted against its 6% per annum long-term trend rate of growth, using a logarithmic y-axis so that a straight line on the chart represents a constant rate of growth. This chart…tells an astounding story that is still almost completely overlooked by most economic and financial market observers.
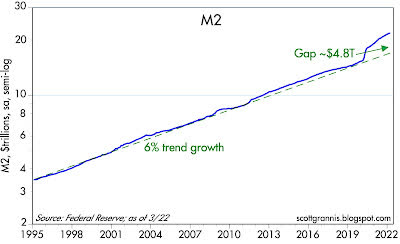
A few things to note in the chart:
- M2 is now about $4.8 trillion larger than it would have been with a continuation of 6% annual growth. Put another way, M2 today is running about 28% above trend, which equates to more than four years of normal growth…
- This chart provides all the evidence one needs to explain why inflation in the past year has far surpassed expectations—and is likely to continue to do so.
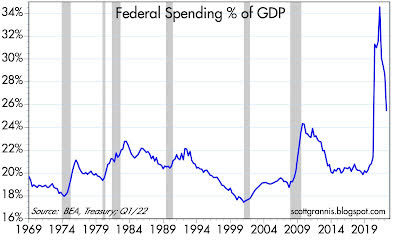
Federal Spending as a % of GDP
As shown in Chart #3 below, both the 2020 surge and the recent slowdown in M2 growth had a lot to do with huge swings in government spending, The surge in spending was all about Covid-19 relief and “stimulus,” and it was entirely financed by issuing new debt, most of which was effectively monetized by the banking system…
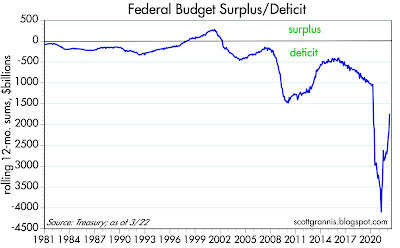
Growth In Federal Revenues
As chart 4 below shows…federal revenues in the past 12 months are up 27% from the year-ago period, with the result that the deficit has collapsed… It’s good that the spending and printing spree has subsided, but the legacy of debt and monetary expansion is still with us.
Growth In Money Demand
Chart #5 below shows the demand for M2, which technically is referred to as the inverse of M2 velocity. (See this post from last January for a more detailed explanation.) Money demand (M2/GDP) is a decent proxy for the percent of the average person’s annual income that he or she wants to hold in the form of cash, checking, and savings accounts (which together comprise M2, the sum of all readily-spendable money).
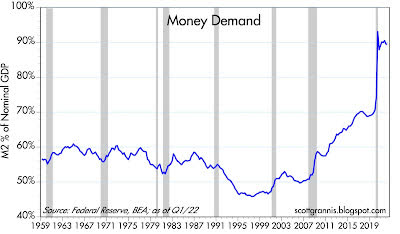
Growth In Currency & Bank Deposit Holdings
For many years, the country’s currency and bank deposit holdings were 55-60% of annual income…[but today] they are a staggering 90%…[which is] only natural…in times of great uncertainty but now that things are getting back to normal and the economy has largely recovered from the…Covid-19 lockdowns and restrictions, we are likely to see a decline in money demand and, indeed, there has already been a decline of about 4% since the initial surge in Q2/21. On the margin, people are no longer desirous of holding so much money, so they are trying to spend down their money balances, and that is what is fueling the resurgence of consumer demand…
Ratio of M2 to GDP
There are two ways for M2/GDP to decline:
- slower M2 growth and/or
- faster nominal GDP growth, which almost certainly entails higher inflation (because nominal GDP has two components: real growth and inflation, and real growth is unlikely to increase by more than 2 or 3% per year).
If the Fed stays behind the curve (i.e., by not raising rates enough), then higher inflation will work to reduce the ratio of M2 to GDP.
Fed Announcement
Yesterday, the FOMC announced plans to:
- shrink its balance sheet starting next month and a 50 bps rise in short-term rates (the overnight funds rate is now 1%) and plans to
- raise rates in 25 and 50 bps increments in a cautious fashion.
The bond market currently expects the funds rate to top out around 3¼ – 3½% in a year or so.
All told, rate hikes will be quite modest as will the reduction of the Fed’s balance sheet. Will that do the trick? We’ll have to wait and see, but the Fed is still far from taking aggressive steps to curtail M2 growth and/or to shore up money demand.
Potential for 10% Inflation In Next 3 Years
- IF M2 continues to grow at 6% per year and the public reduces its money balances to the pre-Covid-19 level of 70% of GDP over the next three years, and real GDP grows by 2% per year
- THEN the annualized inflation rate for the next three years would be about 10%.
The above gives you an idea of the inflationary potential of the current level and growth rate of M2.