…[I]t sometimes happens that risks dictate finding refuge in cash and, more so, the safest of the lot – gold. We are going through such a period. The United States debt is gigantic and we must add to it the debt of the rest of the world. To the point, it is this global accumulation of debt for the last 100 years, and especially since, we abandoned the gold standard, that is putting the whole monetary system in jeopardy. This debt liquidation is favorable to gold, but also to silver. These days, one must take action to protect one’s assets rather than increasing them.
So says Dan Popescu (goldbroker.com) in edited excerpts from his original article entitled The Stock Market Priced in Ounces of Gold.
[The following is presented by Lorimer Wilson, editor of www.munKNEE.com and may have been edited ([ ]), abridged (…) and/or reformatted (some sub-titles and bold/italics emphases) for the sake of clarity and brevity to ensure a fast and easy read. This paragraph must be included in any article re-posting to avoid copyright infringement.]
Popescu goes on to say in further edited excerpts:
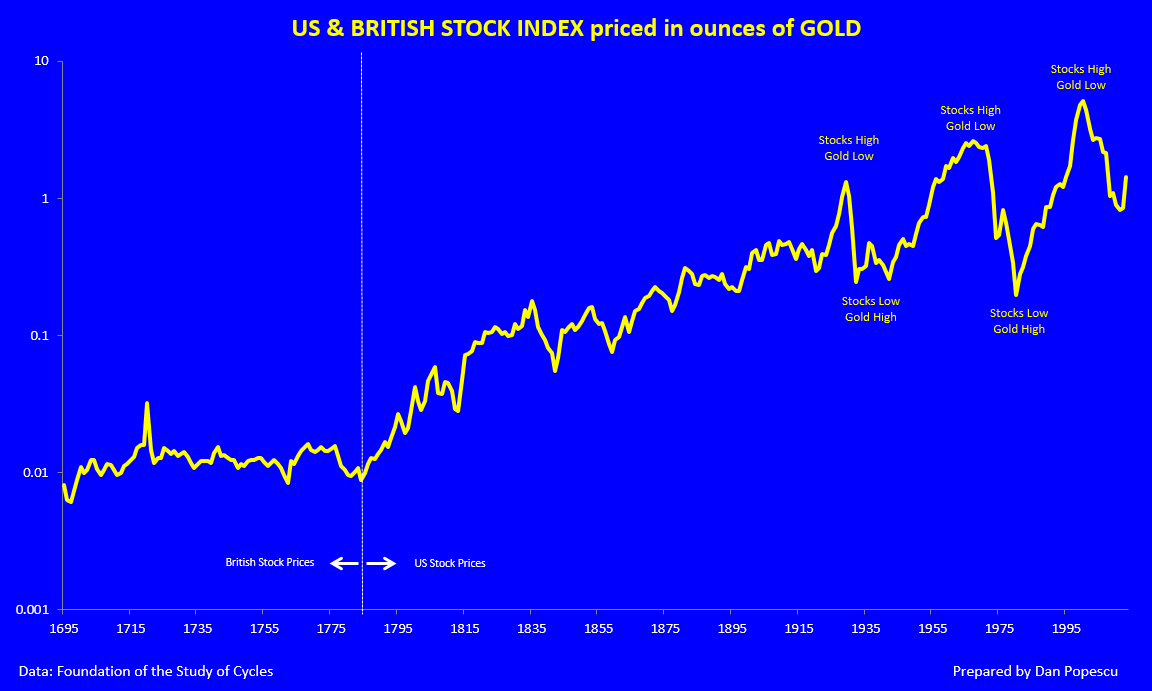
Chart #1 below of the financial market measured in ounces of gold since 1700 shows changes that occur maybe once every 100 or even 300 years. By observing the market priced in ounces of gold rather than in dollars or British pounds, we eliminate the effects of inflation. We can also observe the enormous increase in market volatility since the start of the century. This corresponds with the birth of fiat paper money and central banks. Instead of stabilising the markets, cycles have been rather amplified and by a lot.
Chart #1: U.S. and U.K. Stock Indexes in Ounces of Gold
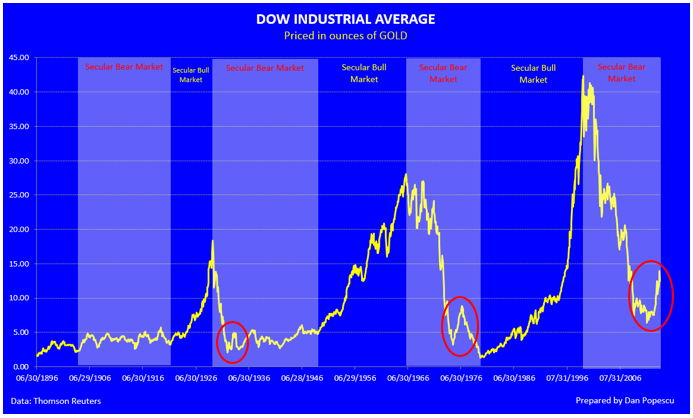
If we only look at the U.S. stock market represented by the Dow Jones in ounces of gold since 1900, we can clearly discern the secular stock market cycles that are not so clearly seen when looked at in US dollars. Inflation muddles the picture, as the bear market looks flat in dollars, whereas in ounces of gold, or adjusted for inflation, it retraces the whole bull market.
By looking at chart #2, a person with a contrarian view might be tempted to conclude that we are at the end of this bear market and at the start of a new secular bull market. However, look again and compare with 1933 and 1976 (chart #2, red circle). It seems rather obvious that we are in the middle of a « bear trap », and not at the start of a new secular bull market. I firmly believe that this Dow Jones bear market will end only when the Dow Jones will be worth an ounce of gold, and maybe less. We are now at about twelve ounces.
Chart #2: Dow Jones Average in Ounces of Gold
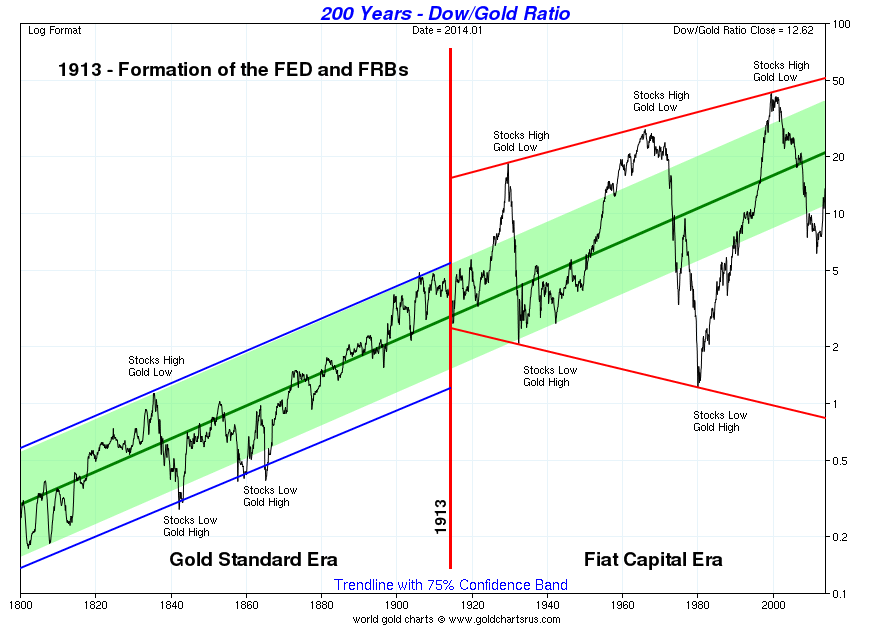
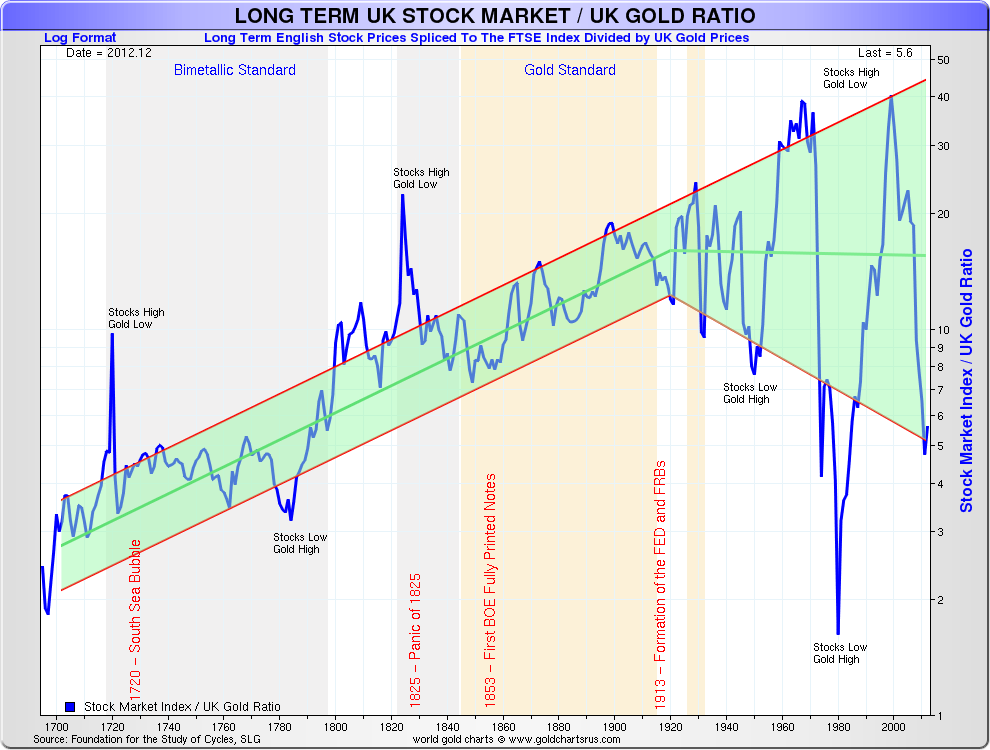
We often hear from those against a gold standard that fiat money has brought stability to the financial markets… Some would even pretended, right at the top of the speculative bubble of 2000, that it was the end of economic cycles. We now know what really happened. We can clearly see the explosion in volatility with the creation of fiat money, as much in the United States (chart #3) as in the United Kingdom (chart #3).
Chart #3: 200 Years of the Dow Jones Average in Ounces of Gold
Chart #4: 300 Years of the U.K. FTSE Average in Ounces of Gold
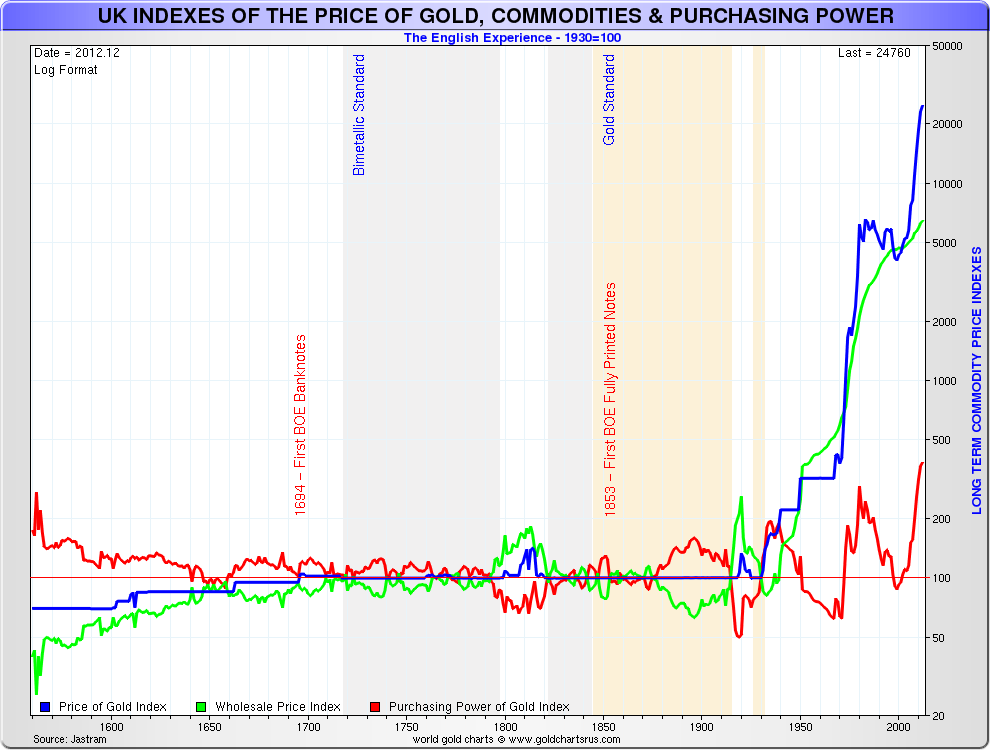
I would hate to finish without showing you another chart (#5) that shows perfectly what has happened since the introduction of paper money, the rising of inflation and, later, the abandonment of all references to gold in the monetary system. First, we can observe the explosion of inflation since 1900 and, second, that gold has maintained its value. Like the Dow Jones, gold has seen its volatility in real terms increase considerably. Inflation produces distortions in prices and, therefore, over- and under-estimations of prices, leading to uncertainty and volatility in the economy.
Chart #5: Nominal Price of Gold, U.K. Producer Prices Index and the Real Price of Gold
The Dow Jones priced in ounces of gold shows the almost perfect negative correlation between the financial markets and gold. This can be explained by gold’s role as hard cash and the absence of distortion caused by inflation. In periods of economic growth, people shun cash and invest, whereas in periods of economic crises, they find refuge in cash. If, on top of that, we have a major crisis in paper money, like today, the bullish moves in gold are accentuated.
The above does not exclude, for short periods, seeing moves on the Dow Jones and in gold in the same direction. It’s possible that, at the start of the Dow Jones bear market, gold also goes down, because to pay down debts, one does not sell something that has lost value but rather something that can still be sold, like assets with value (gold, for instance). Later the Dow will continue to fall, and gold will start its move to new highs.
The recent manipulations on the stock market and in gold by measures such as extremely low interest rates and gold selling on futures markets will certainly increase. However, once their temporary effects subside we will have a continuation of the bear market in the Dow Jones and a continuation of the bull market in gold. If the secular cycle repeats, we can conclude that the Dow Jones will be priced at an ounce of gold or even less.
[Editor’s Note: The author’s views and conclusions in the above article are unaltered and no personal comments have been included to maintain the integrity of the original post. Furthermore, the views, conclusions and any recommendations offered in this article are not to be construed as an endorsement of such by the editor.]
*https://www.goldbroker.com/en/news/stock-market-priced-ounces-gold-450 (GoldBroker.com © 2011-2014; All rights reserved; Charts courtesy of Nick Laird, www.Sharelynx.com)
Related Articles:
1. How Has Gold Performed vs. the Dow In the Past Decade?
The chart below comparing the performance of gold vs. that of the DJIA over the last decade may be a surprise to some – and most certainly your financial advisor. Take a look and if you like what you see send a copy to him/her suggesting that with gold currently on sale at distressed prices that now may be a good time to add some to your investment portfolio. Read More »
2. Gold to Go Ballistic Causing the Dow-Gold Ratio to Ultimately Reach 1:1 – Here’s Why
In an environment of ultra expansionary monetary policies…the long-term trend for gold is higher and as inflation surges, gold will go ballistic resulting in the Dow-Gold ratio touching one. [Let me explain why that will indeed be the case.] Words: 760 Read More »
3. What Does the Future Hold for the Dow:Gold Ratio?
The Dow:Gold ratio is defined as the ratio of the price of the Dow Jones Industrial Average divided by the price of gold [or] how many ounces of gold it takes to buy the 30-stock Dow. The current Dow:Gold ratio of 8.5 is up 21.1% from its 17-year March 6, 2009 low of 7.0 and 81% below its 1999 peak of 44.77. [What does the future hold? Higher gold prices, lower stock prices or vice versa?] Words: 400
 munKNEE.com Your Key to Making Money


This article deserves to be studied by every person that manages a portfolio of any size, since the concepts mentioned are basic to everyones goal of preserving wealth!