…While it is unclear what impact the next few interest rate hikes will have on the real economy (it is not even clear that 25 or 50 basis points (0.25% or 0.50%) of additional tightening will have an enormous impact, other than a short-lived bout of volatility, on asset prices) the long term impact is a different story. A more active Fed may have an enormous impact on how investors build portfolios, a development we…contemplate in this article.
The comments above and below are excerpts from an article by Russ Koesterich (BlackRockBlog.com) which may have been enhanced – edited ([ ]) and abridged (…) – by munKNEE.com (Your Key to Making Money!)
to provide you with a faster & easier read.
In the post-crisis world, bonds have been a poor source of income, but they have been a good source of diversification. In recent years, the correlation between stocks and bonds has been more reliably negative (see the chart below; a negative correlation means stocks and bonds don’t move in sync).
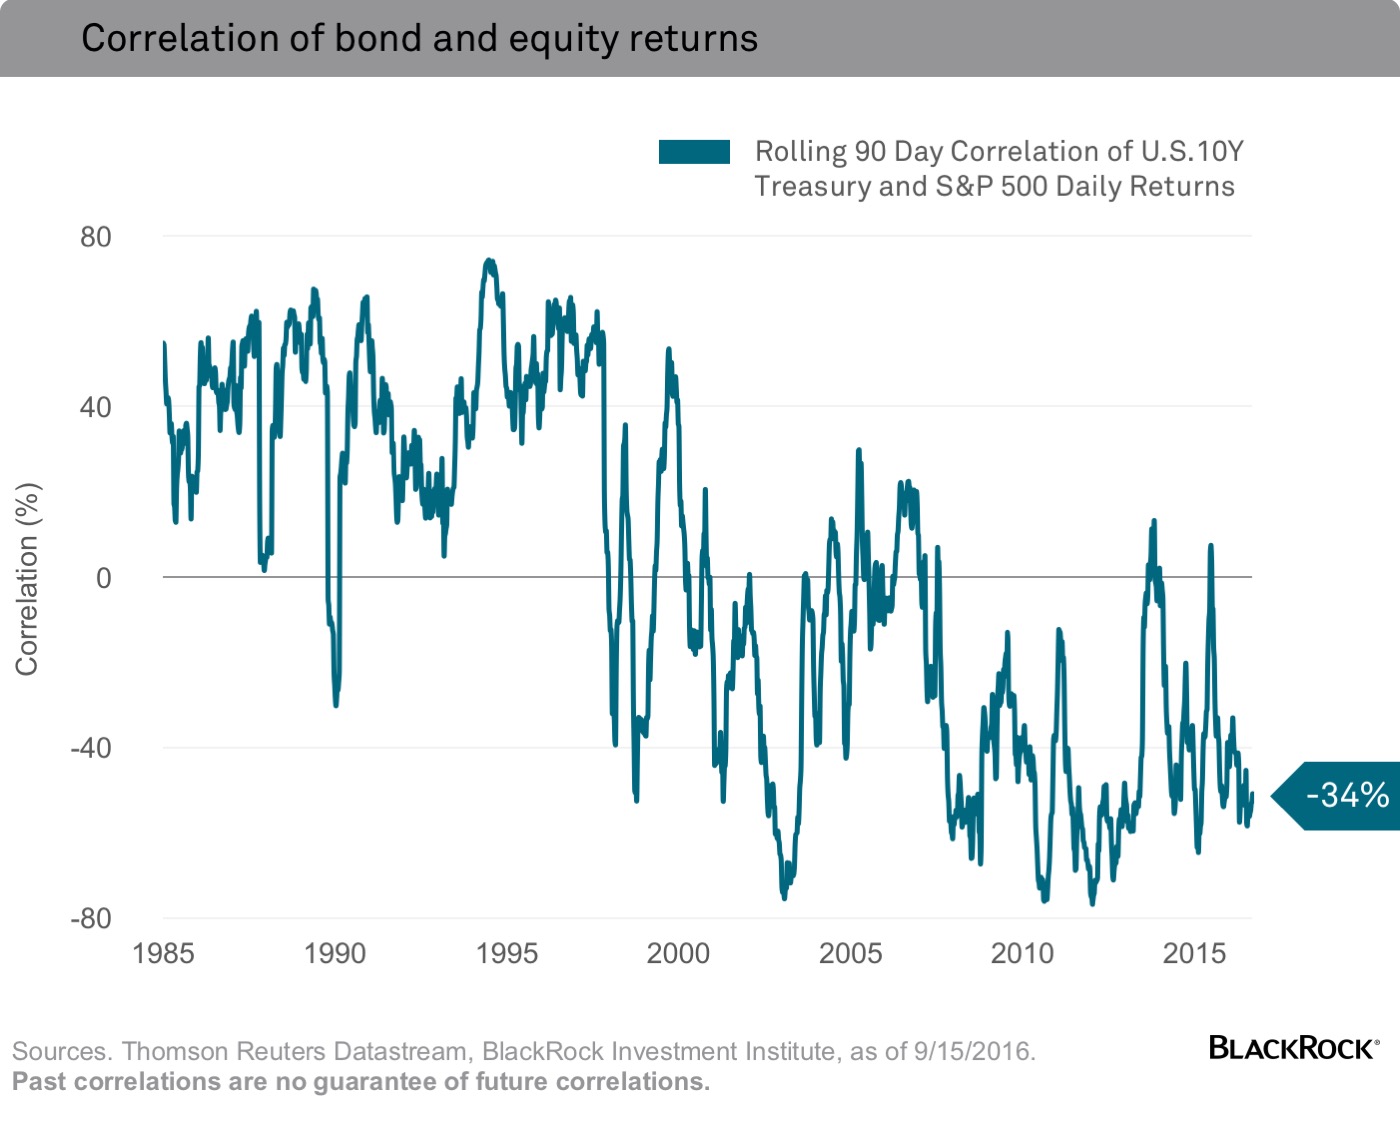
In answer to the question “Why should this be the case given that over the long term, the correlation between stocks and bonds tends to fluctuate?”, it is important to recall that the Fed’s policy rate has remained extremely low for many years, predating the financial crisis, given the persistent slow-growth regime:
- since 2001, the federal funds rate has averaged just 1.60%;
- prior to 2001, the average, including the low rates of the 1950s, was around 6%.
In this low-rate environment, investors have rarely had much reason to “fear the Fed.” Rather than an aggressive central bank, slow or no growth has generally represented the bigger threat to markets. This is important as the correlation between stocks and bonds has tended to relate to monetary policy, specifically the federal funds rate.
- Correlations have historically been lower when the Fed has set and maintained a low-policy rate.
- As a rough rule of thumb, when the federal funds rate has been above 2%, the median stock/bond correlation has been 0.19.
- When the rate has been below 2%, as it has since 2008, the median correlation has been -0.39.
What correlation has to do with diversification
This has significant implications for portfolio construction. While cash is obviously less volatile than bonds, to the extent bonds tend to rise when stocks are declining, bonds may provide a more effective hedge against equity risk. Conversely, if stocks and bonds are moving together, cash is probably the better way to dampen portfolio volatility. This is borne out using BlackRock’s Aladdin Portfolio Builder, our proprietary risk analytics and portfolio construction and management tool.
- A typical 60/40 U.S. stock/bond portfolio (with the 60% stocks measured by the S&P 500 and the 40% bonds by the Barclays Aggregate Index) and a 60/40 stock/cash portfolio have roughly the same expected, or ex-ante, risk (about 8.65%). However, over the past five years, they performed differently depending upon the nature of the market shock.
- During the U.S. debt downgrade in 2011, the 60/40 stock/bond portfolio lost money, but still outperformed the 60/40 stock/cash portfolio. The reason: Systematic fears pushed bond yields down and prices up.
- However, with the “rate shock” in 2013, the stock/cash portfolio lost less as stocks and bonds both fell together on concerns over a less accommodative Fed.
The lesson: The source of the volatility may matter as much, if not more, than the magnitude. If the source is the Fed, bonds may not provide the familiar diversification that investors have come to rely on.
Follow the munKNEE – Your Key to Making Money! “Like” this article on Facebook; have your say on Twitter; register to receive our bi-weekly Market Intelligence Report newsletter (see sample here , sign up in top right hand corner)