“Follow the munKNEE” via twitter & Facebook or Register to receive our daily Intelligence Report (Recipients restricted to only 1000 active subscribers)
I view the current market weakness in gold, coupled with the pullback in trader positions, as a shorting opportunity which is strong in terms of reward vs. risk. I have come to that conclusion by questioning the assumptions that many make about it, isolating its fundamental drivers and providing a trading recommendation as to where I believe the price is headed in the future. Let me share my analyses with you. (Words: 1440; Charts: 4; Tables: 1)
So say edited excerpts (paraphrased) from an article* written by QuandaryFX and posted on Seeking Alpha under the title Prepare to Short Gold.
Lorimer Wilson, editor of www.munKNEE.com (Your Key to Making Money!), may have further edited ([ ]), abridged (…) and/or reformatted (some sub-titles and bold/italics emphases) the article below for the sake of clarity and brevity to ensure a fast and easy read. Please note that this paragraph must be included in any article re-posting to avoid copyright infringement.
The article goes on to say, in part:
Myth #1: Inflation
The first thing that comes to mind when individuals think of purchasing gold is inflation. For the majority of my life, gold has been advertised as the ultimate hedge against inflation in that as inflation increases, physical assets increase as well and by owning gold, individuals will preserve or increase their buying power. This relationship between gold and inflation simply isn’t true.
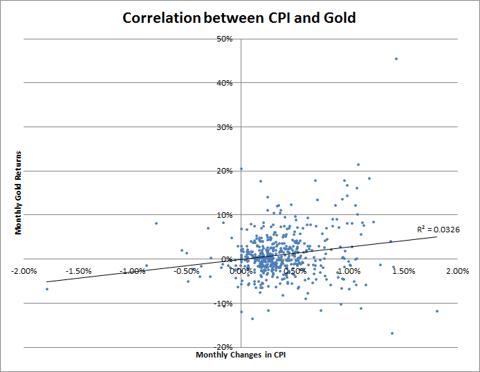
Inflation increases prices in that there are more dollars chasing the same amount of goods. For a good to actually increase in price due to inflation, there must be sufficient demand for the good such that individuals with dollars are willing to pay greater amounts of money for the same amount of the good or service. Let’s pose and test a basic question: does gold increase in price as inflation increases? In order to answer this question, I have correlated monthly changes in the Consumer Price Index (a popular measure of inflation) with monthly changes in spot gold prices. The chart below shows this correlation.
The relationship between inflation and gold prices simply isn’t there. As inflation increases, gold moves in a direction entirely unrelated. Mathematically speaking, the correlation between inflation and the price of gold is only 0.18 which is considered to mean little to no correlation is present.
Myth #2: Financial Panic
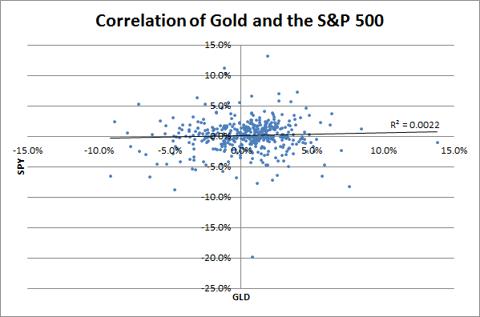
Well, if inflation doesn’t direct gold prices, what about the stock market? It makes sense that as the world markets tank, investors flock to “safe” assets which will “preserve” buying power, right? Wrong. The basic idea here is that in the event of market collapses, investors will flee to gold and preserve their purchasing power. Let’s test this belief by correlating weekly market returns with weekly gold returns.
It can clearly be seen that once again, popular theories don’t hold weight against data. If gold was a method of preserving value in the event of financial volatility, then there would be a negative correlation between the S&P 500 and gold or a clearly-defined relationship as points deviate from the mean. Neither of these factors is present. In fact, the correlation between the stock market and gold is .04, which basically means that there is no relationship present.
Myth #3: Supply and Demand
Another myth that individuals espouse is that there is some sort of supply shortage in which the natural demand for gold is driving up price. This is radically incorrect. According to the World Gold Council, the demand is currently being met and slightly exceeded by supply, on average. Additionally, there is over 44 times the average quarterly demand for gold sitting in stocks. In any other commodity, this type of supply, demand, and storage situation would lead to price collapse. Imagine if we had 44 times our quarterly consumption of wheat already sitting on the shelves in some form or fashion – wheat prices would be a fraction of what they are today! Simply said, a supply and demand relationship is not influencing the price of gold in any tangible way.
Sentiment
I’ve worked within the trading industry long enough to know that there are only three things which drive prices:
- supply,
- demand, and
- sentiment.
We’ve talked about supply and demand and found that these factors are ultimately irrelevant and powerless to influence gold’s price behavior. That leaves us with the only other possible factor: sentiment. It is my belief that the only factor which is driving gold right now is sentiment and the best way to determine sentiment is to monitor the Commitments of Traders (COT) reports.
The Commodity Futures Trading Commission requires large traders and commercial players to disclose their position on a weekly basis so as to prevent position limit infractions and potentially manipulative behavior. These charts make excellent timing tools in that they show us where the professionals are positioned. It is very important to understand that these positions are put on by people who literally must make money on their trader or search for a new line of work. In light of this reality, traders and investors should highly regard COT reports.
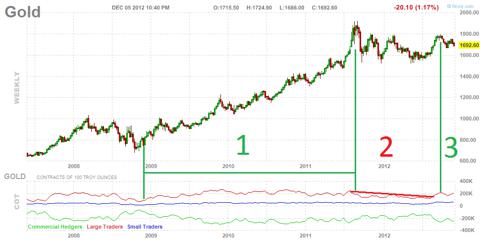
The chart below shows the past four years of COT data.
- The red squiggly line at the bottom of the chart shows the total position of large professional traders – people who are paid to be right.
- The green line shows commercial hedgers – people who intentionally pay to be wrong by hedging their production.
- The blue line shows small traders – people who, for the most part, are amateurs just having fun. In many markets, small trader positions act as a strong contrarian signal in that the amateurs are almost always wrong.
During the first time period which represents the time period between 2009 and the middle of 2011 and labeled “1” in the chart above, professional traders, on average, maintained positions totaling around 180,000 contracts. The price of gold increased 100% (or $800 per ounce). The standard contract represents 100 Troy ounces which means that during this time professional traders earned around $14.4 billion in profits.
During the second time period, labeled “2”, professional traders cut back on their position. Between the middle of 2011 and 2012, traders booked profits on about 50,000 contracts. The selling by these large traders caused the market to stop its multi-year bull-run for several quarters. Commercial hedgers (the green line) also cut back on their positions due to the fact that decreasing prices allow a player who is naturally short to decrease its hedge exposure.
It gets really interesting at point “3”. The large leap in traders’ positions during the past quarter coincides with the speculation and announcement of QE3. QE3, as you probably know, is the Federal Reserve’s announcement that it will continue to essentially print money in order to stimulate business. Printing money eventually leads to inflation. The popular belief about inflation increasing the price of gold is simply incorrect, as we’ve discussed. Professional traders know this, but realistically they put these trades on hoping that the amateurs are unaware of the lack of relationship. Ultimately, trading is a zero-sum game and the only way these guys make money is through the systematic transfer of wealth from the uninformed to the informed. If you notice, immediately after traders put large positions on leading up to QE3, professionals cut back their positions by around 30,000 contracts. Let’s talk about why….
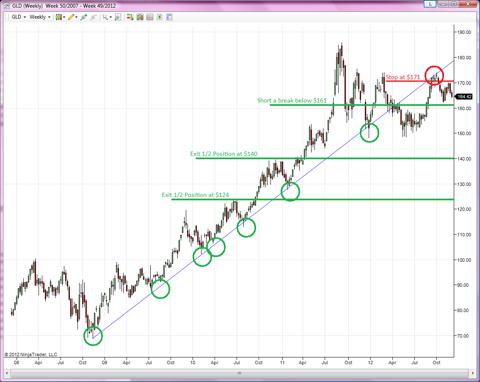
Something very significant happened which caused these traders to cut back on their positions by nearly 15%. For the most part, these professional traders are following the trend: as price increases, they are long and as price decreases they are out of the market or short. A very important shift in sentiment occurred during the first week of October, which was the failure of gold to resume its uptrend, technically established in 2008. What this tangibly means is that the trend is no longer increasing and traders are cutting back their positions to book profits or quickly cut losses. I have circled this rejection (in red) of the uptrend on the chart…[below].
Conclusion
I view this market weakness coupled with the pullback in trader positions as a shorting opportunity. The inability of gold to make new highs coupled with the fact that the recent highs correspond perfectly to technical resistance points makes a short thesis strong in terms of reward versus risk.
 munKNEE.com Your Key to Making Money


