The GDX has declined over 10% on a closing basis [since the end of May and] late last week broke the major support zone when it closed below 52.50. That is not good news for the gold mining bulls, but given the current dynamics of price and volume action in GDX, a bounce is due. [Let me show you why.] Words: 850
So says Wayne A. Corbitt (http://www.ppttrader.com/) in excerpts from an article* which Lorimer Wilson, editor of www.munKNEE.com (It’s all about Money!), has further edited ([ ]), abridged (…) and reformatted below for the sake of clarity and brevity to ensure a fast and easy read. Please note that this paragraph must be included in any article re-posting to avoid copyright infringement. Corbitt goes on to say:
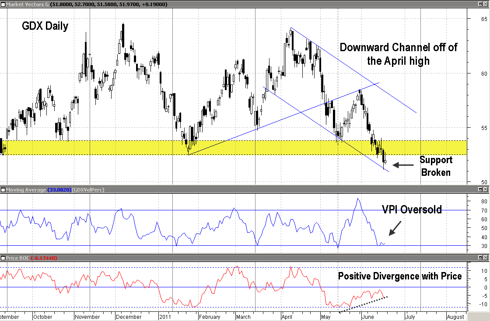
The chart below shows how GDX has been in a well defined downward channel since the April 8 high of 64.14 was posted.
So why would I be calling for a bounce after the breaking of such major support? There are three reasons outlined in the chart above:
- Price is now touching the bottom channel line that was drawn by connecting the March 29 low and the cluster of lows in mid May. This should provide short term support.
- The VPI (in the middle window) is now in oversold territory which increases the odds of a bounce as negative volume flows have run their course for this leg down
- The 21 day Rate of Change indicator in the bottom window is showing a strong positive divergence with price action. Price made a lower low while price momentum did not. Even though there is a divergence increasing the possibility of a bounce higher, notice that the Rate of Change is still well below zero which shows a negative price trend.
If GDX bounces here this opportunity might be best used to unload shares if you haven’t already. I would not treat this as a longer term buying opportunity as the dynamics right now are just too negative. More aggressive short term traders may want to jump on board for this bounce but be aware that the downsloping upper channel line off of the April high should provide strong resistance – if price gets there at all.
Who in the world is currently reading this article along with you? Click here to find out.
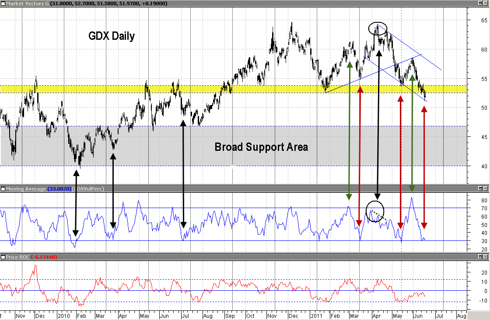
The chart below provides a longer term look at GDX and shows the anatomy of a trend change. There are a lot of arrows on the chart, so please bear with me.
- First notice the price pattern each time the VPI hits oversold territory (below 30 on its own scale) during the uptrend on the left side of the chart (black arrows). Each time the VPI reached oversold territory, price made a higher low.
- Now take a look at the right side of the chart. The red arrows show the opposite situation – the last two times the VPI reached oversold territory, price made a lower low.
- You can also see that the green arrows show that the last time the VPI reached overbought territory (over 70 on its own scale), it made a lower high than the previous time. This shows a noticeable shift in the volume pattern from bullish to bearish.
- Finally, take a look at the VPI as price made its final high in April (both circled connected by a black arrow). As price made its final high and struggled to attempt to get there one last time in late April – the VPI was breaking down which showed no volume support whatsoever for the final push. In other words, the foundation needed to support higher prices was crumbling. That is where the first signs of trend change were evident.
So where is next support? The large gray area in the chart above covers the range from roughly 40 to 47. I know this is a wide range, but this is the area where buyers hammered out a bottom before GDX broke out to new highs. Could buyers see good value there again? There are no guarantees that price will get that low, but given the current price pattern, the odds definitely favor at least a push below 50.
Conclusion
Let’s wait for the bounce and the next rollover. How GDX behaves at that point should give us enough information to discern whether or not a meaningful bottom has been established. Remember also that another cycle change point is due in a few weeks which will also provide more evidence for the decision making process. Remember that perma bulls and perma bears always leave themselves open to needless losses.
*http://seekingalpha.com/article/275634-gold-miners-in-gdx-break-support-but-a-bounce-is-due
Related Articles:
-
Negative Sentiment Suggests Buying Gold & Silver Stocks NOW https://munknee.com/2011/06/negative-sentiment-suggests-buying-gold-silver-stocks-now/
-
NOW is the Best Time to Buy Gold Stocks! Here’s Why https://munknee.com/2011/06/now-is-the-best-time-to-buy-gold-stocks-heres-why/
-
Gold & Silver Warrants Index (GSWI) Update https://munknee.com/2011/06/gold-silver-warrants-index-gswi-update/
-
Buying Gold & Silver Company Warrants is Easy & Profitable – Here’s How (and Why!) https://munknee.com/2011/05/buying-gold-silver-company-warrants-is-easy-profitable-%e2%80%93-here%e2%80%99s-how-and-why/
-
Gold Mining Stocks Are CHEAP Compared to Price of Gold https://munknee.com/2011/06/gold-mining-stocks-are-cheap-compared-to-price-of-gold/
Editor’s Note:
- The above article consists of reformatted edited excerpts from the original for the sake of brevity, clarity and to ensure a fast and easy read. The author’s views and conclusions are unaltered.
- Permission to reprint in whole or in part is gladly granted, provided full credit is given as per paragraph 2 above.
 munKNEE.com Your Key to Making Money


The Gold Miners Bullish Percent Index is at 30 right now. Anytime its under 35 (or close to it) its a BUY for me. It has not failed me yet.
http://stockcharts.com/freecharts/gallery.html?$BPGDM