What will the future top prices for physical gold and silver be? Naturally, no one knows for sure but many analysts have developed interesting models and scenarios as to what the future holds and this article reviews 3 such analyses for your consideration.
The following analyses are heavily edited and paraphrased excerpts from the articles (linked below) of GE Christenson (DeviantInvestor.com) for your review and consideration. Check out his site for more details.
[The following is presented by Lorimer Wilson, editor of www.munKNEE.com and has been edited, abridged and/or reformatted (some sub-titles and bold/italics emphases) for the sake of clarity and brevity to ensure a fast and easy read. This paragraph must be included in any article re-posting to avoid copyright infringement.]
Christenson goes on to say in edited/paraphrased excerpts from his 3 articles:
1. The Hi-Lo Gold Model
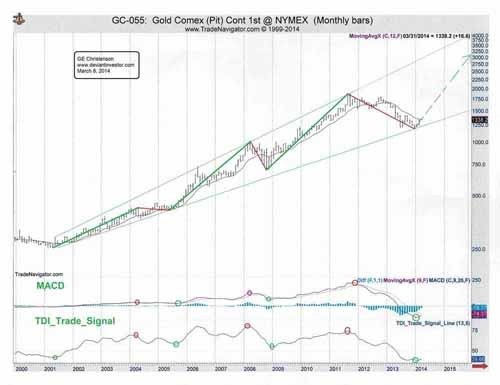
The following chart shows monthly prices for gold since 2000:
This table shows the price and approximate number of years.
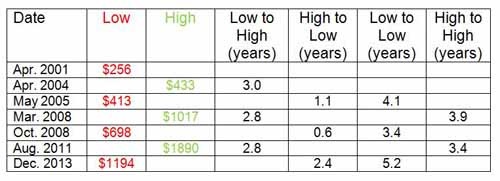
The price of gold bottomed in 2001, rallied for 3.0 years, fell for 1.1 years, rallied for 2.8 years, fell for 0.6 years, rallied for 2.8 years, and fell for 2.4 years. Lows were about 4 years apart, highs were about 3.5 years apart, and the rallies lasted, on average, about 3 years. Gold in December of 2013 had dropped to the lower logarithmic trend line after falling for 2.4 years. The patterns suggest that the next move should be a rally that lasts approximately 3 years to new highs near the top of the trend channel well above $3,500. (Source: *Gold: 14 Years and Three Patterns)
2. The Gold Equilibrium Model
I have developed a Gold Equilibrium Model based on three variables which calculates the equilibrium gold price with no reference to oscillators or technical indicators. It produced an excellent statistical correlation of 0.98 with the smoothed price of gold over the 42 years from 1971 – 2013. See graph below of results.
The GEM is intended to replicate the smoothed annual prices for gold, filtering out most of the market noise and, as such, not predict actual weekly and monthly gold market prices. That being said, and for what it is worth, from an analysis of the data gold:
- was priced about 30% ABOVE the EGP in August of 2011
- was priced about 26% BELOW the EGP in December of 2013 and
- should achieve a price of $1,580 by the end of March of 2014.
Gold prices, based on this long-term model, are currently low and are likely to move much higher over the next several years….
Given the following assumptions that:
- Macro-economic variables continue to increase and decrease as they have for the past 42 years.
- The U.S. economy continues along its typical, but weakened, path with government expenses growing more rapidly than revenues, as they have for decades. National debt rises inevitably.
- Congress continues its multi-decade habit of borrowing and spending, talking about change, and changing little…
- Monetary, political, and fiscal policies will NOT be materially different from what they have been during the past 42 years.
- The U.S. will NOT be subjected to global nuclear war, Weimar hyperinflation, or an economic collapse, while we will continue to be subjected to the same Keynesian economic nonsense that has created many of our current “challenges.”
a reasonable projection for the EGP (a “fair” price for gold) in 2017 is $2,400 – $2,900. Remembering that market prices can spike significantly above or crash below the EGP for many months, we could see a spike high above $3,500 or $4,000 in 2017. Extraordinary events such as a global war or dollar melt-down could push prices higher and sooner. (Source: **This Gold Model Calculates Prices Between 1971 & 2017)
3. Bubbles & the 80/20 Rule
What could happen if gold and silver rise into another speculative bubble? To arrive at the answer I analyzed the time and price data for:
- the South Sea Bubble in England from 1719 -1720,
- the silver bubble from August 1971 to January 1980,
- the NASDAQ bubble from August 1982 to March 2000,
- the Japanese Real Estate bubble from 1965 to 1991,
- the gold bubble from August 1971 to January 1980, and
- the S&P mini-bubble from August 1982 to March of 2000.
I determined that all bubbles start slowly and then accelerate to unsustainable highs (on large volume) that are largely created by greed and fear but not fundamental evaluations. Such bubbles generally follow the “Pareto Principle” where approximately 80% of the price move occurs in the LAST 20% of the time:
- Phase 1 takes approximately 70-80% of the time and covers approximately 10-20% of the total price change.
- Phase 2 accelerates so that it takes only 20-30% of the time but covers 80-90% of the price change. (Extreme bubbles such as the South Sea Bubble and the Silver bubble experience approximately 90% of the price change in the 2nd phase.)
- The ratio of the phase 2 ending price to beginning price is typically 4 to 8 – a huge price move. Such bubbles are rare; the subsequent crash is usually devastating.
Some definitions are in order:
- A ‘bubble” is defined as a speculative mania in a market that is priced well beyond what the fundamentals and intrinsic value indicate.
- Phase 1 of a bubble begins with the price bottoming and initiating a long rally which hits a new “all-time” high.
- Phase 2 of a bubble starts when the price exceeds the “new high” and then rallies to a much higher and unsustainable level.
In the opinion of many analysts, including myself:
- sovereign debt is an ongoing bubble that could burst with world-wide consequences.
- Should deficit spending and bond monetization (Quantitative Easing) accelerate in the next several years, as seems likely, sovereign debt bubble will inflate further.
- Because of the massive printing of dollars, the value of the dollar must fall, particularly against commodities such as oil, gold, and silver.
- As the purchasing power of the dollar falls an increasing number of people will realize their dollars are losing value, and those people will seek safety for their savings and retirement by buying old and silver in an increasingly desperate search for safety.
Assuming the 80/20 “rule” and the phase 2 price change ratio of approximately 5,
- if we assume that phase 1 for silver was a move from $4 to $50 and that represents 19% of the total move, the high for silver could be around $250. The ratio of phase 2 ending price to beginning price would be 5:1 – reasonable.
- a phase 2 bubble price for gold could be around $9,000 per ounce. The ratio of phase 2 ending price to beginning price would be 4.7:1 at $9,000.
The above are not predictions of future prices of gold and silver; it is an indication of what could happen in a speculative bubble environment based on the history of previous bubbles. Past bubbles have had an ending price 4 – 8 times higher than the phase 2 beginning price, so history has shown that such prices for gold and silver are indeed possible. Possible is not the same as certain – but these bubble price indications are certainly worth your consideration. (Source: ***Past & Future Speculative Bubbles – What They Indicate for Gold and Silver!)
[Editor’s Note: The author’s views and conclusions in the above article are unaltered and no personal comments have been included to maintain the integrity of the original post. Furthermore, the views, conclusions and any recommendations offered in this article are not to be construed as an endorsement of such by the editor.]
*http://www.deviantinvestor.com/5573/5573/ (Deviant Investor; Copyright © 2014 – All Rights Reserved; **http://www.deviantinvestor.com/5545/5545/ Deviant Investor Copyright © 2014 – All Rights Reserved; ***http://www.deviantinvestor.com/2388/past-future-speculative-bubbles-what-they-indicate-for-gold-and-silver/ (Deviant Investor Copyright © 2014 – All Rights Reserved)
Related Articles:
1. Gold:Silver Ratio Suggests Much Higher Future Price for Silver – MUCH Higher!
The majority of analysts maintain that gold will reach a parabolic peak price somewhere in excess of $5,000 per troy ounce in the next few years. Given the fact that the historical movement of silver is 90 – 95% correlated with that of gold suggests that a much higher price for silver can also be anticipated. Couple that with the fact that silver is currently greatly undervalued relative to its average long-term historical relationship with gold and it is realistic to expect that silver will eventually escalate dramatically in price. How much? This article applies the historical gold:silver ratios to come up with a range of prices based on specific price levels for gold being reached. Words: 691 Read More »
2. These 10 Charts Suggest the Outlook for Gold Is Good for 2014 and Beyond
Very poor sentiment towards gold and oversold conditions is reminiscent of the conditions seen in late 2008 and January 2009 [as seen in the chart below] when gold prices had fallen by more than 25% in 9 months. Subsequently, gold rose from a low on January 15, 2009 at $802.60/oz to a high less than 12 months later at $1,215/oz for a gain of over 50%. A similar move today would see gold above $1,800/oz by year end. Read More »
3. Nick Barisheff: “Today’s the 2nd-Greatest Opportunity to Buy Gold Since 2002!”
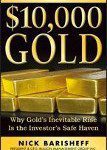
Last year…saw gold’s greatest decline in 32 years…but I’m still confident that gold’s bullish fundamentals are still intact and that what I said in my recently published book, $10,000 Gold, still holds true. Here’s why. Read More »
4. Rickards: Gold Going to $7-9,000/ozt. in 3 to 5 Years! Here’s Why
Gold is technically set up for a massive rally to $7,000 to $9,000 per ounce in three to five years based on a collapse of confidence in the dollar and other forms of paper money. Read More »
5. Silver Has the Potential to Increase 4-Fold From Today’s Price – Here’s Why
The price ratio of gold to silver has fallen precipitously in raging bull markets for the metals, so the silver price could have an upwards move at four times the rate of any gold price increase. I think that the fundamentals look better than ever, and…[that] there is an explosive move coming in 2014. [Indeed,] I think that within a reasonable timeframe silver will probably trade over $100. Read More »
6. Silver On Its Way to $50/ozt. & Then to “Blue Sky Country”
Silver has moved above its 200-day moving average which is a signal for silver prices to challenge the $50 area, overcome it and then traverse ‘blue sky country’ to target the upper trendline shown in the chart shown below. Read More »
7. Gold: What Do Terms “Karat” & “Troy” Mean? What’s A “Carat”?
What’s the difference between 1 troy ounce of gold and 1 (regular) ounce? What’s the difference between 18 and 10 karat gold? What’s the difference between a .75 and 1.0 carat diamond? Let me explain. Read More »
8. Gold Price Forecasts (Update): $5,000 to $11,000 In 2 to 5 Years
During 2011 into 2013 I kept a record of those individuals who expected gold to rise substantially in the coming years and presented updated summaries in a number of articles (see links below). Below are additional or recently updated forecasts by 11 prognosticators whose projections are surprisingly consistent, on average, with previous such estimates. Read More »
We are now starting the hyperinflationary phase in the USA and many other countries – and this will all start in 2014. What will be the trigger? The answer is simple – the fall of the U.S. dollar. Read More »
100+ accredited manufacturers produce a staggering 400 different gold bars among them. This article outlines five rules to follow before, during and after the purchase process. Read More »
I believe there is more opportunity in the silver market over the next two years relative to gold and, as such I’m now advocating accumulating a large overweight position in silver relative to gold because, over the long-term, there is such a great demand vs. supply situation developing….Before investing in silver, however, there are a number very important things that you must understand about the silver market. Let me explain. Words: 899 Read More »
12. Compare & Save When Buying Gold: Check Out These Worldwide Dealers
Compare and save! Who is the most reputable, cheapest and most reliable precious metals dealer to buy your physical gold and silver from? There are hundreds of dealers touting their wares but when it comes to direct comparisons only a few rise to the top of the list. Here they are. Words: 262 Read More »
13. The Future Price of Gold and the 2% Factor
It is my contention that the price of gold rallies whenever the U.S. dollar’s real short-term interest rate is below 2%, falls whenever the real short rate is above 2%, and holds steady at the equilibrium rate of 2%. Let me explain. Read More »
 munKNEE.com Your Key to Making Money








PM’s UP says it all…
Got PM’s ?