 “Follow the munKNEE” via twitter & Facebook or Register to receive our daily Intelligence Report
For the month of January, U.S. stocks experienced the best month in more than two decades [and the Dow hit 14,009 on Feb. 1st for the first time since 2007]. Per the Stock Traders’ Almanac market indicator, the “January Barometer,” the performance of the S&P 500 Index in the first month of the year dictates where stock prices will head for the year. Let’s hope so…. [This article identifies 5 more solid reasons why equities should do well in 2013.] Words: 453
So writes Frank Holmes (www.usfunds.com) in edited excerpts from his original article* entitled Dow To 14,000… and Beyond?.
This article is presented compliments of www.FinancialArticleSummariesToday.com (A site for sore eyes and inquisitive minds) and www.munKNEE.com (Your Key to Making Money!) and may have been edited ([ ]), abridged (…) and/or reformatted (some sub-titles and bold/italics emphases) for the sake of clarity and brevity to ensure a fast and easy read. Please note that this paragraph must be included in any article re-posting to avoid copyright infringement.
Holmes goes on to outline the 5 reason, as follows:
1. Sentiment at a High
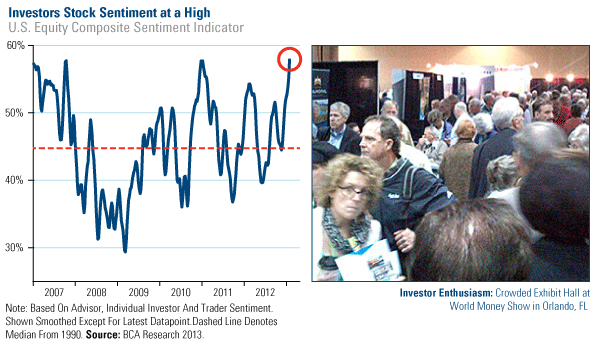
Sentiment among individuals, advisors and traders has experienced a sudden spike recently…53% of those surveyed expect equities to be the best-performing asset class over the next year. This represents a “17-point jump over the previous poll in November, and the highest reading in the four-year history of the survey,” says BCA.
Indices Not at Extreme Levels
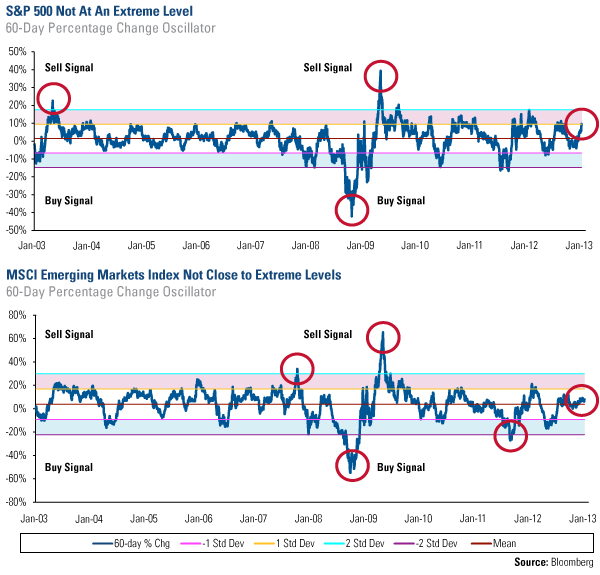
…It’s common to question if the market has climbed so high that it might correct and revert to a long-term mean. Take a look at the oscillator [below] to see today’s incredible shift in context with its historical moves. Using 10 years of data, the S&P 500 Index has moved one standard deviation from its mean over the past 60 trading days. The MSCI Emerging Markets Index is only about a half of a standard deviation from its mean over the same time frame. These charts indicate that the indices are not at extreme levels, like the low we experienced in 2009 or the high a few months later. Rather, the stocks are moving within their normal band of volatility.
…BCA believes, “equities should outperform Treasurys over a cyclical horizon of two-to-three years.” The research firm points to the relatively strong earnings season in the U.S. and the Federal Reserve’s ongoing monetary stimulus, “which should provide a tailwind for stocks.”
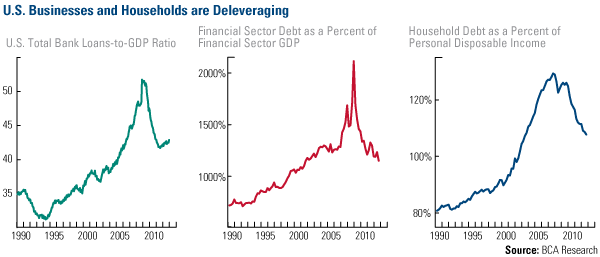
3. U.S. businesses and households are deleveraging
After hitting a peak, you can see in each of the charts below that there has been progress in bringing down the levels of debt across businesses as well as individual households. Less debt gives consumers and companies more confidence to invest, spend and hire.
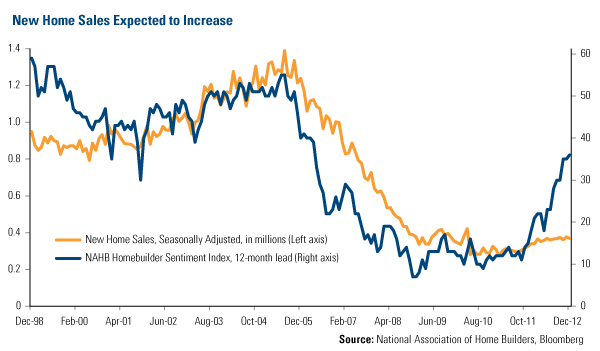
4. New Home Sales Should Increase
Home builders have become increasingly optimistic, as measured by the NAHB Homebuilder Sentiment Index, which has climbed significantly higher in recent months. Historically, new home sales have eventually followed, which is positive for employment, commodity demand, collateral stimulation, cars and appliances.
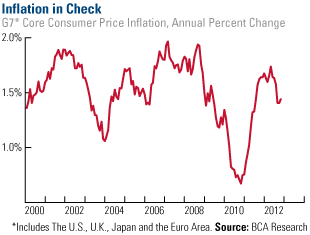
5. Inflation Remains Low
As you can see in the chart, inflation remains low in Japan, Europe, the U.S. and the U.K., with core consumer price inflation falling below 1.5 percent, according to BCA Research. Even though many developed nations are printing money and are experiencing the “most extreme monetary stimulus in modern times,” inflation is stable.
Editor’s Note: The author’s views and conclusions are unaltered and no personal comments have been included to maintain the integrity of the original article. Furthermore, the views, conclusions and any recommendations offered in this article are not to be construed as an endorsement of such by the editor.
*http://www.usfunds.com/media/files/pdfs/investor-alert/_2013/2013-02-01/Investor_Alert_02-01-2013.pdf
Register HERE for Your Daily Intelligence Report Newsletter
It’s FREE
The “best of the best” financial, economic and investment articles
An “edited excerpts” format to provide brevity & clarity for a fast & easy read
Don’t waste time searching for informative articles. We do it for you!
Register HERE and automatically receive every article posted
“Follow Us” on twitter & “Like Us” on Facebook
Related Articles:
At some point we are going to see another wave of panic hit the financial markets like we saw back in 2008. The false stock market bubble will burst, major banks will fail and the financial system will implode. It could unfold something like this: Words: 660
2. World Economy & Market Forecast: More Sunshine & Less Stormy Weather Ahead
It seems clear that there are a number of investors who have gained confidence in the global economy and are seeking to capture the growth opportunities taking place around the world. With the European crisis comfortably in the rear view mirror and global central banks taking the position that they will continue their easing policies, investors have taken their foot off the brake and have begun to accelerate….We see more sunshine and less stormy weather ahead [and explain why that is the case in this article]. Words: 695; Charts: 3
3. Start Investing In Equities – Your Future Self May Thank You. Here’s Why
As Winston Churchill once said: “A pessimist sees the difficulty in every opportunity; an optimist sees the opportunity in every difficulty” and in that vain I challenge all readers to fight off the negativity, see long-term opportunity in global equity markets and, most importantly, remain invested. Your future self may thank you. Words: 732; Charts: 6
Without economic growth, and real economic growth at that, there can be no meaningful long-term economic recovery in the developed countries. Growth or lack thereof will have to be reflected in the financial markets over time. Currently, I continue to see a disconnect between where the financial markets are pricing things, and where I think they ought to be pricing things. Words: 784
5. What Recovery? Contradictions Between Reality & Political Claims Are Everywhere!
There is no recovery, regardless of what the elite and their minions in the media want you to believe. The economy is sick. It was made so by the malpractice of government and will become even weaker as government continues to administer the poison that got us to this point. The political class’s version of remedy is akin to the medical profession’s practice of bloodletting. Neither does any good and both, carried to extreme, are fatal. [Let me explain more fully.] Words: 548
6. Ignore Wall Street Cheerleaders: Market Technicals, Fundamentals & Other Info Says Otherwise!
[In spite of what] the typical Wall Street cheerleaders, I mean strategists, are predicting, we see the equity market ever more closer to its cyclical top, miners about to retest a major bottom and hard assets with a new catalyst. [This article analyzes 9 pieces of information, complete with charts, that show what is actually going on in the marketplace at this point in time and what the short-term future holds.] Words: 930; Charts: 87. What You Should Know About the “Dogs of the Dow” Investment Strategy
The “Dogs of the Dow” is a simple and effective strategy that has outperformed the Dow over the last 50 years and generates almost 4% in yield. Here’s how it works. Words: 486
8. 5 Sound Reasons Investors Would Be Better Off On the Sidelines Than In the Market
New year festivities have continued on the stock market even as the Christmas trees have been put away. The “death of the fiscal cliff,” not horrible job numbers and supportive comments from Mario Draghi on the other side of the pond have led to bold and bullish behaviors over the last three weeks. While no one can predict the exact peak, here are five reasons you’re better off on the sidelines than in the market.
We are in for a tough time for the next four years if the chart below, showing a big dive in economic development expectations, is any indication – ahd here is probably why that is the case. (Words: 200; Chart: 1)
 munKNEE.com Your Key to Making Money


