While no one can predict the exact peak, here are five reasons you’re better off on the sidelines than in the market.
So writes Arsene Lupin in edited excerpts from his original article* posted on Seeking Alpha under the title 5 Reasons To Head To The Sidelines On The U.S. Market.
This article is presented compliments of www.munKNEE.com (Your Key to Making Money!) and may have been edited ([ ]), abridged (…) and/or reformatted (some sub-titles and bold/italics emphases) for the sake of clarity and brevity to ensure a fast and easy read. Please note that this paragraph must be included in any article re-posting to avoid copyright infringement.
Below are Lupin’s 5 reasons why you are better off on the sidelines:
1. Fundamentals Wisdom. Byron Wien is legendary on Wall Street and has a 30-year track record on yearly predictions. [While] no one is perfect; Byron is better than the rest. At 50% accuracy for 2012 (which is substantially better than the Street), he was right in the critical prediction that the S&P would end about 1400 by the end of 2012, as also on the excessive pessimism on Europe. For 2013, the very same Byron Wien predicts S&P 1300, caused not by a fiscal cliff but an earnings cliff. [Read: Byron Wien: 10 Events That Will Likely “Surprise” Us In 2013]
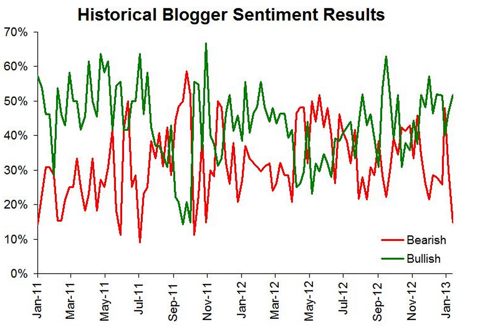
2. Technician Wisdom. Birinyi made his name on the Street in the 80s by using mutual fund money flows to predict stocks and markets, and was a regular on the pioneering program, Wall Street Week by Louis Rukeyser. He continues to share his wisdom about both institutional and individual investor sentiment on the Tickersense, the Birinyi associates blog. The current investor sentiment (see below) is as strong a signal as the market is going to give you that it is overbought. Can it get more overbought? Possibly. Are you placing a low odds bet if you buy now? Indubitably.
3. ‘Hedgie’ wisdom. Tom DeMark is another ilk of ‘technician for hire’ and revered by the hedge fund community. He is an advisor to the (somewhat maligned but incredibly smart) SAC hedge fund run by Steven Cohen. DeMark correctly predicted the timing and valuation of the S&P bottom in 2011. DeMark calls for a S&P descent to the 1350 range after a short-term market top.
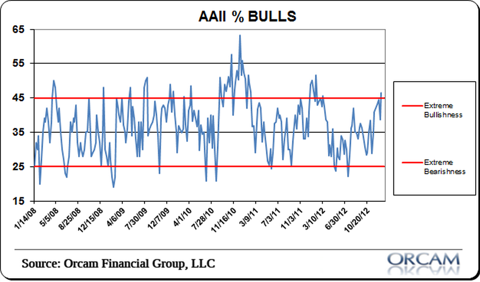
4. Small Investor Sentiment. The American Association of Individual Investors (AAAI) is another highly regarded investor analytics institution. There bulls vs bears tracker (see below) confirms Birinyi’s analytics, and flashes a strong warning signal for those contemplating a market entry in the near future.
(click to enlarge)
5. Earnings Cliff. Doug Kass is a hedge fund manager known for calling the March 2009 bottom right around Dow 6900. Concerned as he is about Washington, the cliff he is highlighting is the earnings cliff, i.e. a shortfall in S&P earnings due to global uncertainty, inflationary pressures and consumer sentiment.
Conclusion
[Given the above,] if you are a conservative investor, you might want to stay on the sidelines. If you are brave, you might venture on the short side. As always, take this as input and conduct your own research.
Editor’s Note: The author’s views and conclusions are unaltered and no personal comments have been included to maintain the integrity of the original article. Furthermore, the views, conclusions and any recommendations offered in this article are not to be construed as an endorsement of such by the editor.
*http://seekingalpha.com/article/1112821-5-reasons-to-head-to-the-sidelines-on-the-u-s-market
Related Articles:
1. Byron Wien: 10 Events That Will Likely “Surprise” Us In 2013
For the 28th year running I have given my views on a number of economic, financial market and political surprises for the coming year….defined as events which the average investor would only assign a 30% chance of taking place but which I believe are “probable”, having a better than 50% likelihood of happening. [Below is my list of 10 surprises for 2013, complete with my rationale for each.] Words: 1037
2. The S&P 500 Continues to Rapidly Build Its “Domed House” As Projected
The broad stock market is on its way to building a “Domed House” and to challenge multi-year highs, or even all-time highs, in the process. Based on the forecast of my proprietary Long Wave Index, the broad market should be in a short-term bullish time-window until 1/17/2013. Words: 634; Charts: 2
3. These Charts Suggest a Possible +/-60% Decline in the S&P 500 by 2014
J.P. Morgan Asset Management has developed a chart showing the past two cycles in the S&P 500 highlighting peak and trough valuations. At face value it is very alarming as it suggests a potential decline of somewhere in the vicinity of 60% over the next year or two and concurs with previous innovative trend analyses included in this article. Charts: 4
4. 3 Reasons the Stock Market Could Rally & 3 Reasons to Be Cautious Near Term
The U.S. stock market rally that kicked off the New Year continued last week, and after only two weeks, US stocks are up around 3% for the year. European stocks have posted similar gains and equities in Japan have advanced even further. What’s behind this rally – and more importantly, can it continue? In my view, the rally can be attributed to three factors. Words: 615
5. Start Investing In Equities – Your Future Self May Thank You. Here’s Why
As Winston Churchill once said: “A pessimist sees the difficulty in every opportunity; an optimist sees the opportunity in every difficulty” and in that vain I challenge all readers to fight off the negativity, see long-term opportunity in global equity markets and, most importantly, remain invested. Your future self may thank you. Words: 732; Charts: 6
6. Don’t Ignore This Fact: “Greedometer Gauge” Signals S&P 500 Drop to the 500s by July-August, 2013!
The S&P500 is likely to achieve a secular (long term) peak this month, then drop to the 500s by July-August 2013. This article explains why. Words: 180
7. Current Market Overvaluation (from 33% – 51%!) Suggests Cautious Long-term Outlook
Based on the latest S&P 500 monthly data, [my analyses indicate that] the market is overvalued somewhere in the range of 33% to 51%, depending on which of 4 indicators I used. This is an increase over the previous month’s 31% to 48% range. [Let me explain the details.] Words: 475
8. Goldman Sachs’ Leading Indicators Signal Steep Market Crash Ahead
Goldman Sachs reports their Global Economic Indicators (GLI) show the world has re-entered a contraction and…is predicting a market crash worse than that of the early 90′s recession and one slightly less than the sell-off at the turn of the millennium. [Below are graphs to support their contentions.] Words: 250
9. Will a Black Swan Event Cause the S&P 500 to Drop by 40%?
Mark Spitznagel…warned the other day that the S&P 500 could lose 40% of its value in the next couple of years. So what black swan event could cause the S&P 500 to drop down to 760? [Let’s take a closer look.] Words: 856
 munKNEE.com Your Key to Making Money

