We now have a really strong probability that the correction which started at $1913 on 23 August 2011 has been completed both in terms of Elliott waves and also in terms of time elapsed. If this is correct, the gold price should soon be expressing itself in violent upside action as it moves into the third of third wave which is still targeted to reach $4,500. [Let me explain in detail (with charts) how and why my most recent analyses confirm my earlier target of $4,500.] Words: 1085
So says Alf Field in edited excerpts from an article entitled “What Happened to Gold?” posted on Egon von Greyerz’ site www.goldswitzerland.com which is a further follow-up (initial follow-up is #3 below) to a speech he gave to the Sydney Gold Symposium last November which was edited and presented in two articles, as follows:
- Alf Field is Back! The “Moses” Generation and the Future of Gold
- Alf Field: Gold Going to $4,500/ozt. in Next Wave Towards Parabolic Peak
- Alf Field: Gold Retested $1,650 as Expected and Now is on Move to $4,500
Lorimer Wilson, editor of www.munKNEE.com (Your Key to Making Money!) and www.FinancialArticleSummariesToday.com (A site for sore eyes and inquisitive minds) has edited the article below for length and clarity – see Editor’s Note at the bottom of the page. This paragraph must be included in any article re-posting to avoid copyright infringement.
Field goes on to say, in part:
Current Elliott Wave and technical studies suggest that the probabilities now favor a strong rise in the gold price.
It may be helpful to consider my personal assessment of the various probabilities at different points in the recent gold market correction.
- On 23 August 2011 when gold pushed above $1910 my guess was that there was a 90% probability of a severe correction.
- The target for the decline, as given in my keynote speech at the Sydney Gold Symposium in November, was circa $1480, the point at which the explosive extension in the gold price had started….
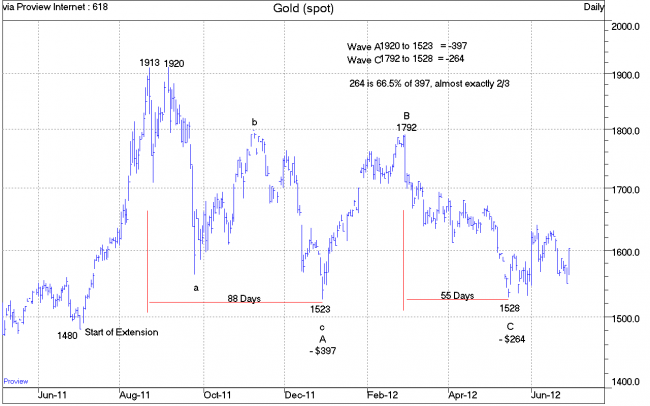
- Gold never got down to target of $1480, stopping not very far away at $1523 in late December 2011. At $1523 all the minor subdivisions suggested that there was a 75% probability that this was the low and that the market would move into a strong upward move, probably the most vigorous of the bull market. A lesser alternative considered was that $1523 might only be the A wave of a larger A-B-C correction.
- Subsequent events proved that the lesser alternative – that $1523 was only the low point of the A wave – proved to be the correct diagnosis. The A-B-C correction is shown in the chart below.
- The upward move from $1523 through January and February 2012 to $1792, a gain of $270 in just 2 months, looked exactly like the vigorous upward move that had been anticipated. From $1792 a correction in the 6%-8% range was expected.
- That meant a maximum retracement to $1650 could be tolerated. A decline below $1650 would indicate that something was wrong with the analysis and would necessitate examining alternative possibilities.
- Gold did drop below $1650, throwing a spanner in the works of the expectation that the market was in the early stages of the massive third of a third wave with a target of $4500.
- Once the 61.8% retracement level at $1626 was also broken, the strongest probability was that the rise to $1792 was the B wave and that the market was declining in the C wave. At this stage it began to look as if gold might still achieve the original downside objective of $1480.
- The decline halted at $1528 and then started rising in a desultory fashion. The above chart was produced at that time showing that the A wave decline had lasted 88 trading days while the C wave decline had lasted 55 days. In addition the C wave decline of $264 was 66.5% of the A wave decline of $397, as depicted on the chart. The 2/3 relationship between the A and C wave declines plus the ratio of 88 days to 55 days absorbed by the respective waves, a neat 8:5 Fibonacci ratio, improved the odds that $1528 was the end of wave C. It would thus also mark the final end of the correction that had lasted since late August 2011.
The above positive assessment was not published at the time. Additional confirmation from further market action was required to be sure of the call. The required evidence of a rapid and large upward surge in the gold price plus the break of the prominent downtrend did not emerge. Gold simply churned within a relatively narrow range below the declining trend line.
A number of readers have urged me to pay more attention to time. In the past I had found that the magnitude of the waves was a much more important factor than the time involved. I had never been able to make an accurate call using only time elements and cycles. Every time I made a forecast based on time, I got it wrong. Nevertheless, I resolved to examine the time elapsed by the different moves more closely.
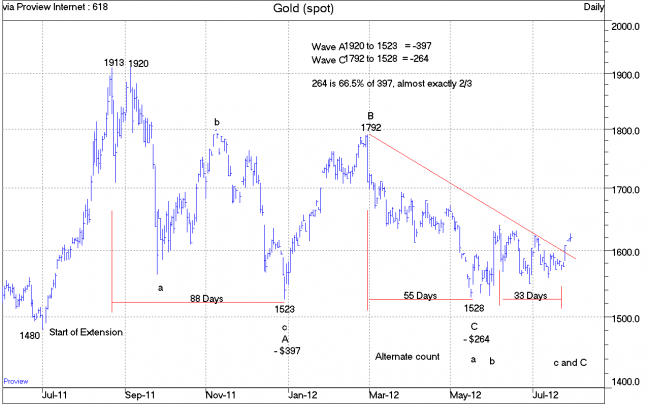
That gave rise to recognizing that the 88 and 55 days absorbed by the A and C wave declines respectively was the interesting Fibonacci ratio of 8:5. With the gold market churning and going nowhere, I developed an alternative theory that $1528 was not the final low point of wave C but only the low point of wave a of an a-b-c move making up the C wave.
That would explain the desultory sideways trading in the gold price and implied that the final low was still somewhere in the future. An extension of this theory was that the decline in the smaller and final wave c to the low would last 33 trading days. This would extend the previous 88:55 ratio to 88:55:33, and would mean that the time absorbed by the two small c wave declines would total 88 days (55 +33), identical to the 88 days absorbed by the wave A decline.
This was pure hypothesis. There was no real basis for this theory, but it seemed worth testing it. If it was possible to predict the day of the final low ahead of time, that would be a significant achievement. Gold had rallied to $1640 on 6 June 2012 and then started churning sideways with a downward trend.
Projecting ahead 33 trading days from 6 June 2012 produced a date for the forthcoming low of 23 July 2012. I didn’t have any idea of what the low price would be. The chart below depicts what happened on 23 July 2012.
The low gold price on 23 July 2012 was $1564, certainly not a new low. Yet the gold price started rising almost immediately. Within a couple of days the gold price had broken upwards through the downtrend line that had been in place since the end of February 2012. This is a very positive development which will be greatly enhanced if the gold price continues to move strongly upwards over the coming days and weeks.
Conclusion
The bottom line is that we now have a really strong probability that the correction which started at $1913 on 23 August 2011 has been completed both in terms of Elliott waves and also in terms of time elapsed. If this is correct, the gold price should soon be expressing itself in violent upside action as it moves into the third of third wave which is still targeted to reach $4500.
HAVE YOU SIGNED UP YET?
Go here to receive Your Daily Intelligence Report with links to the latest articles posted on munKNEE.com.
It’s FREE and includes an “easy unsubscribe feature” should you decide to do so at any time.
Join the crowd! 100,000 articles are read monthly at munKNEE.com.
Only the most informative articles are posted, in edited form, to give you a fast and easy read. Don’t miss out. Get all newly posted articles automatically delivered to your inbox. Sign up here.
All articles are also available on TWITTER and FACEBOOK
Editor’s Note: The above posts may have been edited ([ ]), abridged (…), and reformatted (including the title, some sub-titles and bold/italics emphases) for the sake of clarity and brevity to ensure a fast and easy read. The article’s views and conclusions are unaltered and no personal comments have been included to maintain the integrity of the original article.
*http://goldswitzerland.com/alf-field-confirms-next-gold-target-as-4500/ (To access the above article please copy the URL and paste it into your browser.)
Previous Alf Field Articles:
1. Alf Field is Back! The “Moses” Generation and the Future of Gold
I have come out of retirement for this one off, once only, speech to warn that the good ship “Life As We Know It” is sinking. You have the choice of getting into a life boat now or going down with the ship. The life boats consist of precious metals and other assets that will survive the coming currency destruction. [Let me explain.] Words: 1400
2. Alf Field: Gold Going to $4,500/ozt. in Next Wave Towards Parabolic Peak
Once this present correction in gold has been completed it should [undergo] the largest and strongest wave in the entire gold bull market…to around $4,500 with only two 13% corrections along the way. [Let me explain how I came to that conclusion.] Words: 1900
3. Alf Field: Gold Retested $1,650 as Expected and Now is on Move to $4,500
Gold it is still tracking well in line with Elliott Wave expectations [which foretold] a rally from the previous low followed by a further decline to [as low as $1,650 before going onwards and upwards. Let me explain the steps that brought me to that conclusion.] Words: 683
4. Where Is This Unprecedented Global Financial Crisis Headed? A Retrospective from Alf Field
Everyone must be wondering where this “unprecedented global financial crisis”, (the World Bank’s words), is heading. What follows, for what they are worth, are my cogitations on this crisis. Words: 1641
5. Alf Field’s 7 “D’s” of the Developing Disaster Revisited
When the supply of something is increased sharply relative to demand, the value of that commodity will decline. If the supply continues to increase rapidly and indefinitely, then that item will become worth less and less, with the potential to finally become nearly worthless. This is the Developing Disaster facing the US Dollar and the world. This is the factor that could become the single most important criterion in investment allocation decisions and possibly even for individual financial survival…[Let me explain this further by reviewing the 7 major problems facing the U.S. (and thus the world) and how they all will lead to problem #7 – devolution.] Words: 1520
6. America’s Current Account Deficit Causing World’s Financial Crisis! Here’s Why
The onset of the world’s worst financial crisis in many decades is one of the most important factors (if not the most important factor) currently influencing investment decisions. The crisis has created chaos and confusion. Not many people understand how the world has arrived at this unfortunate situation. This report endeavours to identify the underlying causes of the crisis and explains why the USA current account deficit has been the main destabilising force in world finance. Words: 3806
 munKNEE.com Your Key to Making Money


