 weeks! Selling has been heavy, key technical levels have been broken, important moving averages have been violated, and momentum is building to the downside. The upcoming drop could be severely sharp. [Let me explain why that is the case.] Words: 1239
Lorimer Wilson, editor of www.munKNEE.com (Your Key to Making Money!), has edited the article below for length and clarity – see Editor’s Note at the bottom of the page. This paragraph must be included in any article re-posting to avoid copyright infringement.
The article goes on to say, in part:
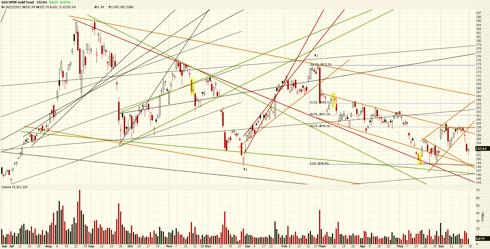
BROKEN TRENDS
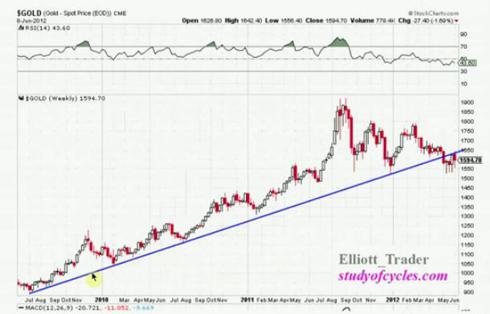
Gold has broken the medium-term trend that has been in place since 2009. By dropping below $1600, gold has broken through both technical and psychological levels. With trend lines broken and key psychological support levels violated, selling pressure will build up and a big sell-off could ensue.
Source: Elliott Trader, StudyofCycles.com
VIOLATED MOVING AVERAGES
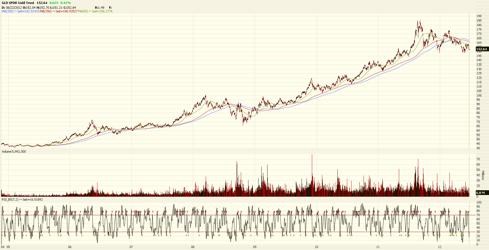
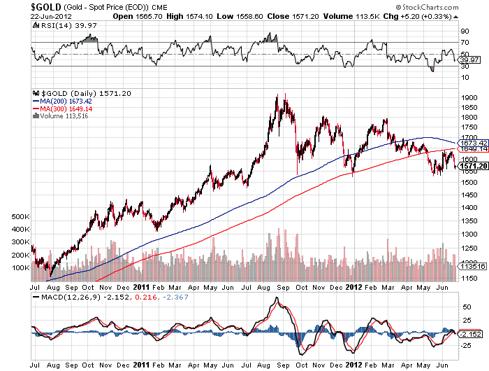
Gold has also broken below very significant moving averages – the 150, 200, and 300 day moving averages. Usually, so long as price is above the moving averages, the momentum is positive and the trend is intact but with a drop below the moving averages, prices have lost their support and now have room to fall as the trend is broken. Even worse, the moving averages above – which once served as support – are now acting as strong overhead resistance. With the 50-day MA crossing below the 200-day MA and the 150-day MA crossing below the 200-day MA, we now also have a confirmed “Death Cross” in moving averages, which bodes very poorly for gold.
GLD breaks below 150 & 200 day moving averages:
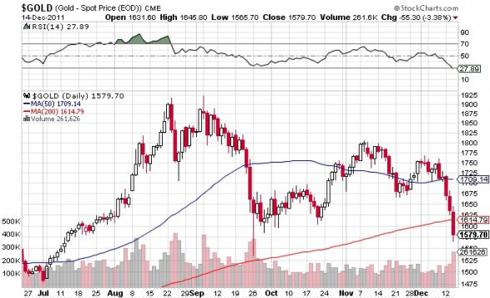
When gold broke below the 200-day Moving Average for the first time, on December 14, 2011, it was a huge event. Even those who didn’t believe in technical analysis still paid attention, and many bulls got scared. BusinessInsider.com, which published the chart below, even called this “The Gold Chart That Everyone is Talking About.”
Prices ended up bouncing above the 200-day moving average again as a “last gasp” effort by the gold bulls. However, gold has since fallen back below the 200-day moving average, and failure for a second time usually results in a fast drop.
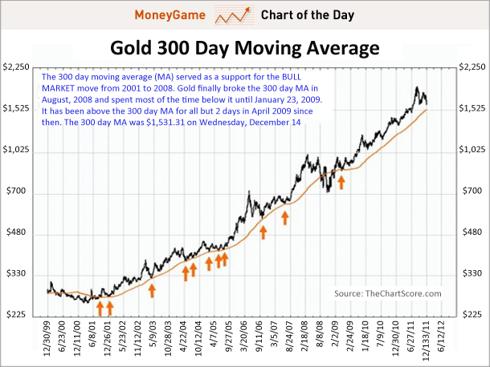
GLD breaks below the 300-day moving average:
To make matters worse, we have broken below what some considered to be the “ultimate proof” that gold would continue to rise – the 300-day moving average. In December 2011, BusinessInsider pointed out the non-conventional 300-day Moving Average as the ultimate proof of gold’s bull market. Supporting its claim with a chart that looks all the way back to when this gold bull market began in 1999-2001 (see chart below), BusinessInsider said “Forget the 200-Day Moving Average, Here’s How You’ll Know The Gold Bull Market Is Over.” The 300-day Moving Average has in fact been very good support during the enormous bull market in gold, and was only broken significantly during the 2008 recession. BusinessInsider pointed out that the 300-day MA should really be our measuring stick for whether this gold bull market is still going strong – and up until that point, gold still looked good.
Well, I guess the bull market in gold is officially over! In May 2012, we decisively broke below the 300-day Moving Average. Now that we are below both the 200- and 300-day Moving Averages, momentum is strong to the downside. Even more, the two moving averages now act as overhead resistance.
Adding trend lines and support/resistance over the past year, it is clear that gold is in a downtrend and that we may be gaining more momentum to the downside, as we may have broken down from a wedge counter-trend rally that lasted from mid-May to June 20, 2012. If prices continue to drop, they will soon face $1500 in spot gold.
KEY TECHNICAL RESISTANCE LEVELS
There is plenty of resistance above, at previous highs, descending tend lines, and moving averages.
Key levels to watch (as of June 23, 2012):
50-day Moving Average – $1609.88
100-day Moving Average – $1654.79
150-day Moving Average – $1657.40
200-day Moving Average – $1673.42
300-day Moving Average – $1649.14
With so much selling pressure above, it simply doesn’t pay to buy gold at these levels – there is too much risk.
MINERS LAGGING GOLD
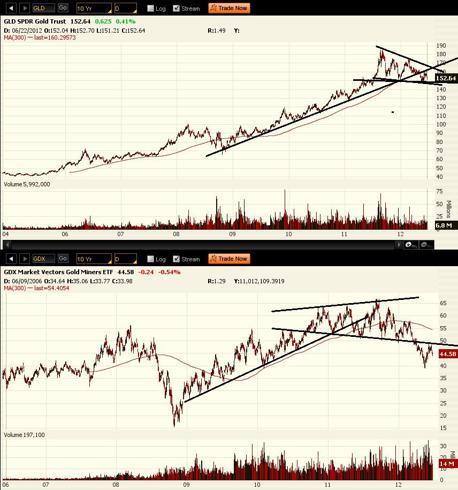
The gold miners, which led the way during the bull market in gold, are leading gold on its way down. While gold continued to much higher highs from late 2010 until its final peak in September 2011, the gold miners moved largely sideways that entire time. The miners have been performing very poorly in comparison with gold, and act as a very strong warning sign that gold is about to follow.
Looking at the “disconnect” between gold and the gold miners, we see that both have broken down through their supporting trend lines. The gold miners also appear to have formed a broadening top formation – an expanding “Megaphone.”
Take Note: If you like what this site has to offer go here to receive Your Daily Intelligence Report with links to the latest articles posted on munKNEE.com. It’s FREE! An easy “unsubscribe” feature is provided should you decide to cancel at any time.
Gold and gold mining stock prices have both recently seen nice bounces following oversold conditions, but have both failed at overhead resistance – the trend lines which used to be underlying support.
Look at how extreme pessimism got before the late-May bounce:
Sentimentrader.com
Normally, such extreme pessimism is a great investment opportunity. However, since gold has been in a soaring 12-year bull market, this extreme pessimism should be a sign that the bubble has popped and the trend is now broken. Extreme pessimism is now possible and, because it is possible, it is only the beginning of that extreme pessimism. Gold prices may bounce up a little, but they will ultimately come crashing back down.
WHY TO SHORT THE GOLD MINERS (GDX)
I have been recommending shorting the gold miners as my favorite way to profit from the collapse of the gold bubble. I have done so through put options, which help me maximize profit from the bearish call while also limiting my risk. Shorting the miners rather than gold is a better choice because the miners are leveraged to the gold price, have taken excess risk by not hedging their positions, and will take a bigger hit when the gold market slides….
While mining companies make great investments during increasing prices in gold they make terrible investments during bear markets. Because their profits and success so heavily rely on the underlying commodity prices, they take huge hits to their financials when prices fall….[As such,] we expect the drops in mining companies to be much more devastating than the underlying commodities – which will be extraordinarily devastating as it is. That’s why our favorite way to short the gold bubble is by shorting the gold miners, and even doing it through put options to maximize returns.
CONCLUSION
Sentiment and public opinion has been growing more negative since the September 2011 peak. Because sentiment changed so rapidly from bull to bear, gold (and silver) were inevitably due for a bounce. The market does not collapse from 100% to 0% in a straight line – when stocks or commodities fall hard, they bounce back up a little as they take a break. Some investors buy in, thinking it is a perfect buying opportunity to buy for cheap but they don’t realize that the bounce is only a “last gasp” before the onset of the much bigger crash. Gold is possibly entering that phase…
With many trend lines broken and technicals pointing to a downside in gold, fundamentals showing slowing demand for gold, deflationary pressures from slowing global economies, and investor behavior revealing an insane amount of enthusiasm and over speculation – gold is NOT the place to be right now. The profits to be made from gold are by betting on the downside, or at least protecting your long positions and physical inventory.
*http://seekingalpha.com/article/681481-gold-s-technical-picture-is-broken-collapse-coming (To access the above article please copy the URL and paste it into your browser.)
Editor’s Note: The above article may have been edited ([ ]), abridged (…), and reformatted (including the title, some sub-titles and bold/italics emphases) for the sake of clarity and brevity to ensure a fast and easy read. The article’s views and conclusions are unaltered and no personal comments have been included to maintain the integrity of the original article.
Related Articles:
1. Dr. Nu Yu: “Breakdown Watch” in Effect for Gold & Silver – Both at Risk of MAJOR Declines!
It is imperative that close attention be given to the price movement of gold & silver in the next week. Gold is exhibiting 2 distinct patterns both of which suggest that if the support lines in both patterns are breached we could have a sharp decline in the price of gold to the level of $1,345 – $1,400/ozt. Likewise, silver could drop to $14.50. The aforementioned being the case we have a “Breakdown Watch” alert on for both gold & silver for this coming week. Let me show you some charts that show you why that is the case. Words: 656
2. Hathaway: Next Round of QE Will See Gold, Silver and Mining Stocks Go Ballistic! Here’s Why
“Even with the prospect of no QE, if you believe the Fed, gold has not made a new low [since December] so, in my opinion, the absence of QE is priced into gold. On the other hand, if market conditions hit emergency levels, the central banks will be forced to their knees and they will be doing QE by whatever name it’s called. I think at that stage you are going to see gold go ballistic because it will be an admission of failure on the part of policymakers….If investors don’t do something now and take advantage of this funky period we are in, this daily grind of back and forth, they are going to be paralyzed. They will just be bystanders when gold finally takes off.”
3. Gold/Silver & Mining Stocks Going From Their Cycle Bottoms to Parabolic Peaks by 2015
Once every year gold and stocks form a major yearly cycle low while other commodities form a major cycle bottom every 2 1/2 to 3 years. Occasionally all three of these major cycles hit at the same time….That’s what’s happening right now and it should lead to a powerful rally over the next 2 years, culminating in 2014 when the dollar forms its next 3 year cycle low. Words: 622
4. Stephen Leeb: Junior Gold Miners Could Go Up 10-fold In Next Few Years! Here’s Why
I think the junior gold miners sector could up ten fold over the next few years based on gold just going to $3,000 or $3,500 [let alone to] $5,000 or $10,000 which I think is possible. Here’s why.
5. Update: 51 Analysts Now Maintain that Gold is Going to $5,500 – $6,500/ozt. in 2015!
Lately analyst after analyst (161 at last count) has been climbing on board the golden wagon with prognostications as to what the parabolic peak price for gold will eventually be. That being said, however, only 51 have been bold enough to include the year in which they think their peak price estimate will occur and they are listed below. Take a look at who is projecting what, by when and why. Words: 644
6. Goldrunner: Fractal Gold Analysis Says Gold On Way to $3,500 Mid-year!
Our Fractal Model suggests the wave for Gold in US Dollars will sweep up into the $3500 to $3600 area into the mid-year time-frame. The leading edge of that time-frame begins in May and extends out for a few months. A potential for Gold to spike to a $3900 extended fib level exists. Like all parabolic moves in Gold, the late stages create the biggest price movements. Personally, I would be happy with a huge Gold run up to the $3200 level. Words: 1400
7. Alf Field: Correction in Gold is OVER and on Way to $4,500+!
There is a strong probability that the correction in the price of gold [down to $1,523] has been completed. The up move just starting should be…the longest and strongest portion of the bull market…at least a 200% gain… [to] a price over $4,500. The largest corrections on the way to this target, of which there should be two, should be in the 12% to 14% range. [Let me explain how I came to the above conclusions.] Words: 760
According to a recent Elliott Wave theory analysis gold is about to go parabolic reaching $3,495 in June 2013, $6,233 in April 2014, $10,899 in Sept. 2014, $18,712 in December 2014 and culminating in a parabolic peak price of $31,672 on January 16th, 2015! See the chart below. Words: 600
9. New Analysis Suggests a Parabolic Rise in Price of Gold to $4,380/ozt.
According to my 2000 calculations, if interest rates and inflation stay constant over the next 2 years, we could expect to see (with 95.2% certainty) a parabolic peak price for gold of $4,380 per troy ounce by then! Let me explain what assumptions I made and the methods I undertook to arrive at that number and you can decide just how realistic it is. Words: 740
10. David Nichols: Expect to See $2,750 – $3,000 Gold By June 2013 – Here’s Why
The interim peaks in gold have been spaced 21 months apart over the past 6 years and have seen gains from 80.2% to 97.3%. As such, given the fact that the low of this last correction came in at $1,524 four months ago, we can expect gold to reach a new peak price of $2,750 to $3,000 in 17 months time (i.e. June/July 2013). [Let me explain in more detail.] Words: 976
11. Leeb: Gold Going to $3,000 Before the End of 2012!
The Fed is [going to] keep interest rates at zero until the end of 2014 [and that] is as aggressive as it gets and as bullish as it gets for gold. Inflation will be let out of the bag, maybe for the next three to four years. In this environment gold and silver are the best investments around…We are really talking about the next leg higher in this bull market…This is the leg I expect to take gold to $3,000 before the end of 2012.
12. Rebound Ratio Suggests New High for Gold By Mid-year
[While] some investors are frustrated,, and a few are worried that gold seems stuck in a rut [such a] stall in price has happened before…[but has] always eventually powered to a new high…[Let’s] examine the size and length of past corrections and how long it took gold to reach new highs afterward. Words: 740The Western world is going to need even more easing, more money. All of this is incredibly bullish for gold longer-term. I do think you have to navigate the end of the euro before the next massive move in gold, but that’s coming. It’s possible that gold may get hit initially as the euro fails, but you have to buy it if it does.
14. GOLDRUNNER FRACTAL ANALYSIS: 2012 SILVER TO $70++
Around this point in the fractal cycle in the late 70’s, Gold busted out of its channel to rise sharply higher, along with Silver. Silver’s channel top will lie up around $68 to $70 over the coming months which we believe will be reached in 2012. The next higher angled resistance bands for Silver run from $112 to $115, and then up at the $123 area. By the end of the Silver Bull, we expect to see Silver reach $500+. Words: 1765
15. James Turk: Silver Will Climb to $68-$70 in 2 to 3 Months
Silver will climb to $68-$70 in 2 to 3 months once resistance at $35 is taken out… In many ways silver is positioned today like it was back in the summer of 2010… Regarding gold, as goes oil, so goes gold…and the bottom line is that the wind is at the back of the bulls in both the gold and oil markets.
16. Alf Field Sees Silver Reaching $158.34 Based on His $4,500 Gold Projection!
This article was prompted by a question enquiring what the silver price might be if my gold forecast of $4,500 proved to be correct [see my article entitled “Alf Field: Correction in Gold is OVER and On Way to $4,500+!” and I have settled on] a target price of $158.34 for silver. [Let me explain how I came to that specific price.] Words: 850
17. Silver Will Go to $50 and Then Explode Dramatically Higher! Here’s Why
There is a massive amount of energy underlying the silver market, and when it is ready to unleash, we will see price/value increases that will stun even the most ardent silverbugs…The real power of this expected move is likely to be released only some time after the price of silver has surpassed the $50/ozt. level. [Let me explain.] Words: 685
18. History Says Silver Could Become the Next 10-Bagger Investment! Here’s Why
If you concur with the 159 analysts (see below) that maintain that physical gold is going to go parabolic in price in the next few years to $3,000, $5,000 or even $10,000 or more then you should seriously consider buying physical silver. Why? Because the historical gold:silver ratio is so way out of wack that silver should appreciate much more than gold as it goes parabolic in the years to come. Indeed, silver could easily reach $100 – $200 per troy ounce, maybe even $300 and conceivably in excess of $400 depending on how high gold goes. The aforementioned may be hard to believe but an analysis below of the historical price relationship between silver and gold suggests that such will most likely occur if gold does, indeed, go parabolic. Take a look. Words: 1423
19. Stephen Leeb: Silver’s Going to $60, $70, by the End of 2012 – Easy!
I think scarcity in oil is a dramatic tailwind for gold. Politicians will inflate. They don’t want oil to bring down the economy like it did in 2008. Remember, this inflation will take place with commodity prices already high. So this will create significant inflation. This means higher gold and silver. Gold at $3,000 by the end of the year, easy. Silver $60, $70, easy.
20. Now’s the Time to Take Advantage of Current Discount on Mining Shares – Here’s Why
Gold stocks are now trading as though peace, prosperity, balanced budgets, and the repudiation of fiat currencies were about to break out across the globe, sending the metal back to $1,000 per ounce in the very near future. Given the stagflation conditions in the developed world, however, and governments’ proclivity to use money printing in order to jump-start an economy, it may be wise to take advantage of the current discount being offered on mining shares.
 munKNEE.com Your Key to Making Money
