Our work with Gold is based on a “Model” off the late 70’s Gold Bull that has been replicating nicely since we started the Fractal Work with Gold back in 2002 and 2003. Short-term volatile moves in Gold, as we have seen over the past weeks, do not affect our projections based on the model, leaving the expectation of a move in Gold up to $3,000 into mid-year intact.
Those are the views of Goldrunner as conveyed to Lorimer Wilson, editor of www.munKNEE.com (Your Key to Making Money!). Please note that this paragraph must be included in any article re-posting to avoid copyright infringement.
Goldrunner goes on to say:
This is no different than our projection calling for Gold going to $1860 to $1920 back in April in an article entitled Goldrunner: Gold on track to Reach $1860 to $,920 by Mid-year. Many thought Gold’s run was finished, but then Gold shot up to tag our $1920 price target on the nose.
The Gold Bull in US Dollars is a parabolic cycle that is created by the fall in value of the US Dollar.
1) The “US Dollar Index” has little relationship to the “Value of the Dollar” once the other paper currencies in the basket are being devalued aggressively. Thus, the Dollar is no safe haven except for very short periods of time late in major Gold Bulls. The global competitive currency devaluation process started in earnest in 2010 – much like it did in the late 70’s cycle. Once the GCCDs start in earnest, the US Dollar Index becomes little but a “fake pricing oscillator”, mostly moving sideways and inversely to the Euro, the largest component of paper currency in the US Dollar Basket.
2) The USD Index is trading much like it did at the same point in the late 70’s once it became a simple oscillator, and the analogous rise in the late 70’s suggests that it will top in the current period somewhere in the 81 to 84 area – and then it will move back down to its lows as Gold rockets higher.
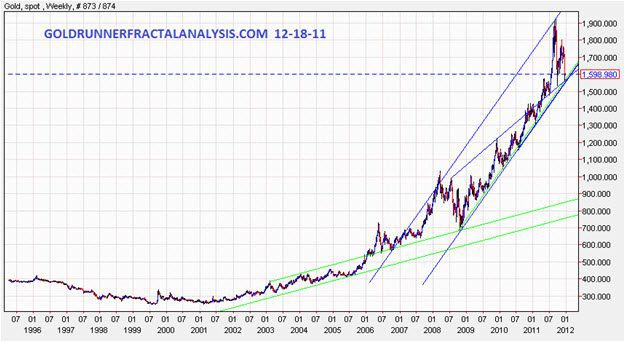
3) Last week gold corrected down into the area of support near its long-term channel uptrend line on the arithmetic chart. The support came at the channel bottom and at angled line support over old tops as seen in the chart below.
Everybody is waiting with baited breath for the Fed to announce the next round of QE while looking at the false pricing index rise for the Dollar. The fact is that the Fed just announced the printing of $600 Billion of new Dollars that are yet to be factored into the $Gold price. That $600 Billion amount is equal to the total amount of the last course of QE that jettisoned the price of Gold in Dollars much higher, and we still expect the Fed to announce a round of QE on top of that so the US Government can pay its bills.
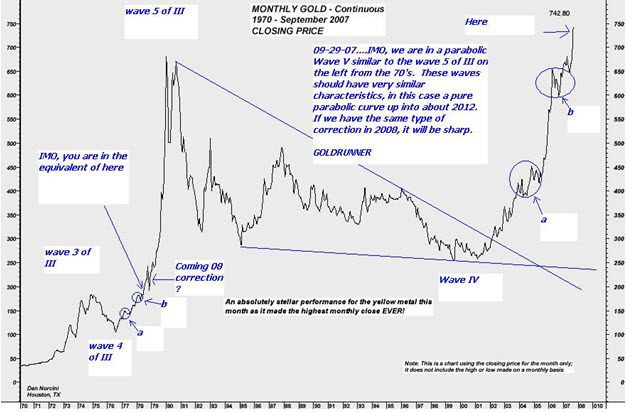
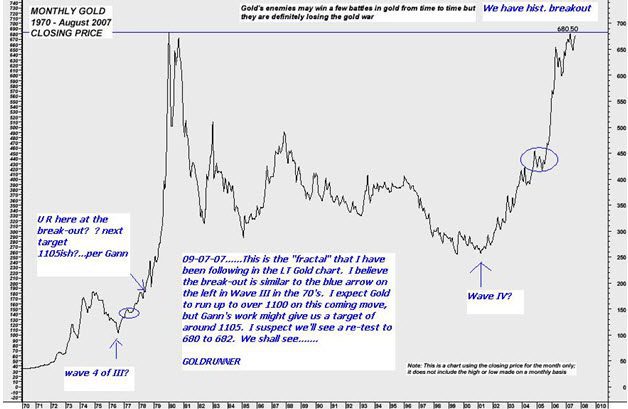
Back in 2007 we had pointed out the expected Deflation Scare correction that was obvious in the late 70’s Fractal Gold Chart. Working off the same Gold Chart Model, back then, we simultaneously pointed out the coming upside into early 2008, and the expected sharp drop into the 4th quarter of ‘08 on the same chart “model.”
There is no equivalent to “another deflation scare” at this point in the cycle off the late 70’s Gold Chart Model, and we believe it is for obvious reasons. The Gold Bull that is created by the aggressive Dollar inflation is driven into the form of a parabola by a relatively constant accelerating inflation of the US Dollar. We expect that the market will very soon turn its attention away from the false pricing Dollar Index, and revalue Gold sharply higher against the US Dollar due to the true increased supply metrics at hand.
THE $GOLD ARITHMETIC CHART
On the chart below you can see the lower channel in green that Gold traded within during the early part of the current Gold Bull running up the low channel base before busting out of the green channel with a huge move out of the top and into a more parabolic growth rate into the blue channel and then underwent parabolic growth as it busted upward into the blue channel.
At this stage in the late 70’s, $Gold made a similar sharp run higher and busted out of the top of the blue channel on the $Gold Chart, much like we saw as Gold busted out of the lower channel in 2005. This is how the Golden Parabola grows. We see a relatively constant acceleration in price per period of time – acceleration in price driven by the devaluation of the Dollar in response to more Dollars being printed in an accelerating way or Dollar Inflation.
If the Dollar Index reflected the value of the Dollar at this point in the cycle, the Dollar Index would have fallen to new lows as $Gold was revalued to new highs against the Dollar as it rose up to $1920, but it did not. The USD basically traded sideways to down from this point forward in the late 70’s while Gold was revalued massively higher against the Dollar into 1980.
Sharp volatility down into the channel bottom can easily be converted into sharp upside momentum if price bottoms and reverses causing investor psychology to reverse sharply.
THE 2008 DEFLATION SCARE GOLD CHART PROJECTIONS
Above and below, are two of the Fractal Gold Charts I posted back in September of 2007 showing where we were in the Fractal Model off of the late 70’s, using two of Dan Norcini’s Gold charts. Note the sharp correction into late 2008 that was denoted on one of the two charts for 2008. Also note that there is no similar sharp correction further along in the late 70’s Gold chart to match “a second deflation scare for today” as the parabola powered onward and upward.
Sign-up for Automatic Receipt of Articles in your Inbox or via
FACEBOOK | and/or
TWITTERso as not to miss any of the best financial articles on the internet edited for clarity and brevity to ensure you a fast an easy read.
Related Articles:
1. Grandich vs. The “Three Stooges of Gold Forecasting” – Gartman, Nadler and Christian
6. Gold Bugs: You Were “Had” in the Recent Decline! Here’s How to See It Coming Next Time
Record lease rates are a primary driver for the near historic sell-off we have experienced but, when negative gold lease rates drop like they are now doing, the underlying tension in the supply and demand for gold as a source of liquidity collapses suggesting that the gold sell- off is likely coming to an end. That said, the next time we approach the previous thresholds..it will likely indicate that another gold-derived liquidity rubberband “breach” is imminent. [Let me explain further so you won’t be “had” next time.] Words: 1054
7. Goldrunner: Gold, Silver and HUI Index to Bounce Back to Major Highs by May 2012
With the present major correction in gold, silver and the mining sector it is important to look at the big picture and see what the charts are saying from a technical fractal relationship with what happened back in 1979 when the last truely major bull run occurred. To date the situation is, frankly, no different than it was back then unfolding just as it should. As a result we can expect MAJOR upward price action in physical gold and silver and in their mining (producers, developers, explorers and royalty streamers alike) in the next few months on their way to their respective parabolic peaks in the years ahead. Read on. Words: 1604
8. Gold Tsunami: on the Cusp of $3,000+?

 munKNEE.com Your Key to Making Money


