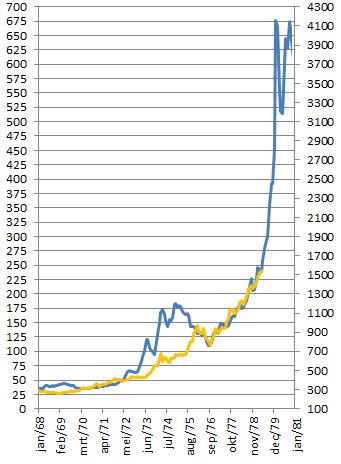
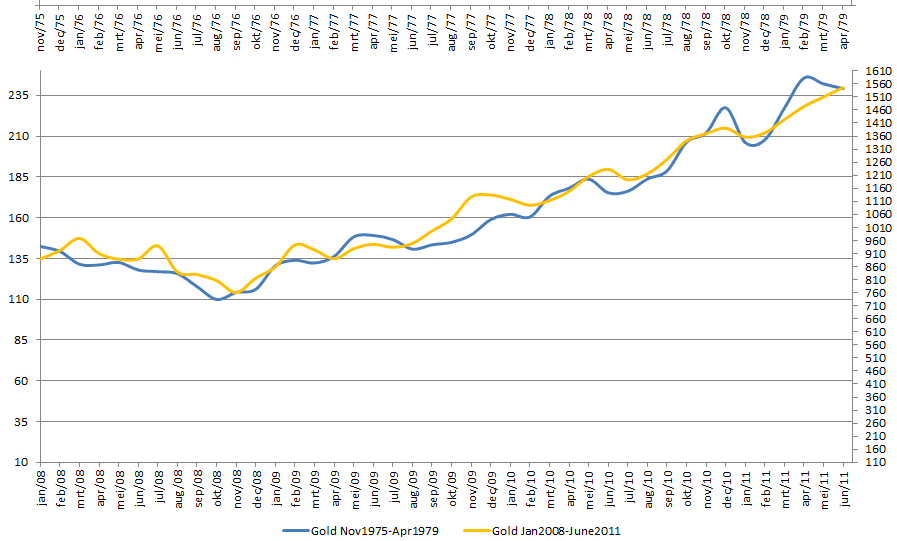
The correlation between the gold price from 1968 until 1979 and from early 2000 until today is an amazing 89.65%! More specifically, the correlation from 1975 until April 1979 and from January 2008 until today is an astonishing 97.83% suggesting that gold will reach an ultimate top of $5,000 per troy ounce before the bubble bursts. Words: 330
So says Willem Weytjens (www.profitimes.com) in excerpts from an article* which Lorimer Wilson, editor of www.munKNEE.com (It’s all about Money!), has further edited ([ ]), abridged (…) and reformatted below for the sake of clarity and brevity to ensure a fast and easy read. Please note that this paragraph must be included in any article re-posting to avoid copyright infringement.
Weytjens goes on to say:
The monthly average gold price since January 1968 is shown in the following chart:

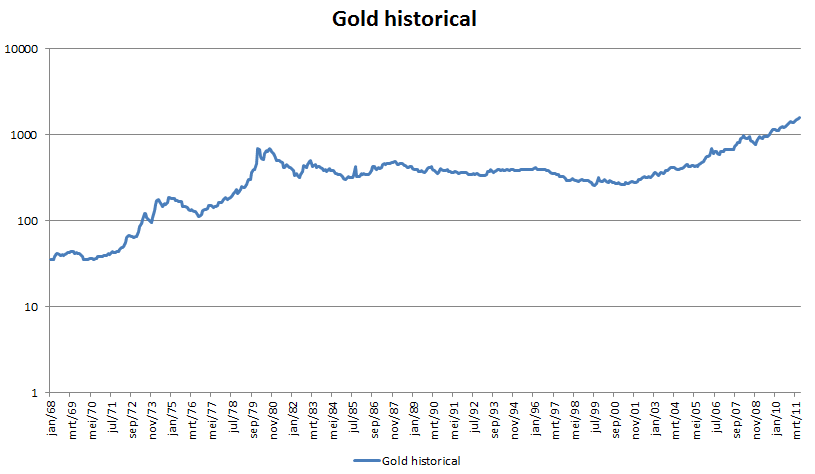
It [may]…look like a bubble [but when looked at on a] log-scaled chart (see below), it looks far from bubbly:
As the chart below shows…the correlation between the gold price from 1968 until 1979 and the gold price from early 2000 until today is an amazing 89.65%:
Don’t believe me? Here is the Excel sheet I used, with data from Kitco.com.
[As such, assuming the above] correlation holds… gold should reach a price of $5,000 per troy ounce… based on the 1981 intraday high of $873 per troy ounce:
*http://profitimes.com/free-articles/gold-headed-to-5000-per-ounce
 munKNEE.com Your Key to Making Money
