The stock market used to be a playground for the elite and the  well-informed but it is now overrun by relatively ignorant retail investors. In light of this, and other dramatic shifts in market conditions, a P/E ratio of ’15’ may now be a real bargain if ’20’ is now the new fair market value. [Let me explain.]
The commentary above & below consists of edited excerpts from an article (see original article* as posted on SeekingAlpha.com HERE) by thestrugglingmillennial.com/.
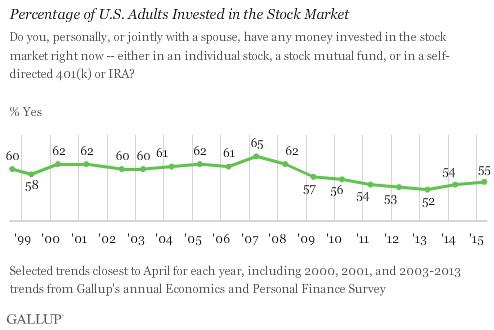
- According to a fairly recent Gallup poll, the percentage of Americans invested in the stock market has dropped from a 2007 high of 65% and currently stands at 55%. That includes “indirect equity investing,” too – indexing in 401(k)s and IRAs, and owning basic mutual funds – not just outright direct stock ownership.
- According to the Federal Reserve, only 13.8% of Americans own stocks directly…
…It’s pretty scary that nearly half of Americans don’t invest in equities, especially since the 401(k) has replaced the pension as the primary investment vehicle in the United States. My generation is really setting itself up for failure if that’s the case. The Baby Boomers are retiring with pensions – guaranteed income streams. Once they’re gone and the next few generations retire, we may have a real crisis on our hands.
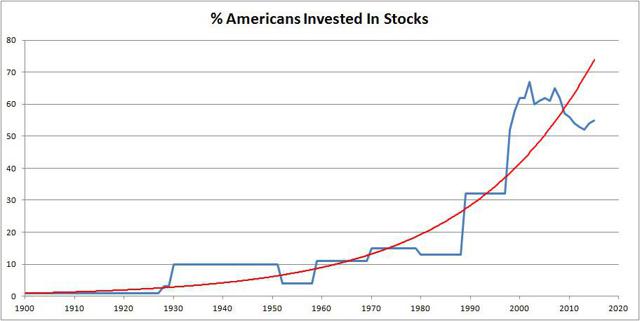
Average Stock Ownership Before & After the Introduction of the Internet
…According to Ben Wattenberg, the chart below reflects stockholders as a percentage of the American population before 1999…
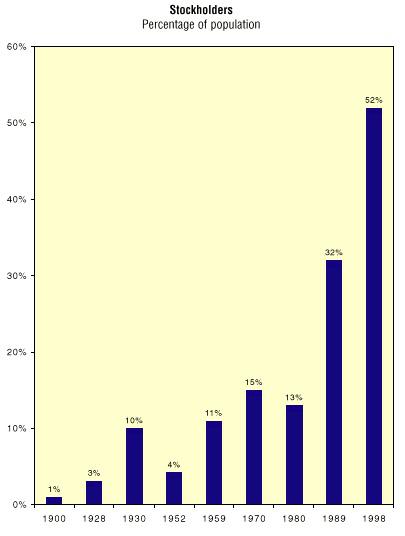
WOW! Talk about a slow century of investing. The retail investor did not become a major part of the equation until the internet took off…
Decades ago, the retail investor simply did not have the means to invest in the stock market while today, it’s so simple a high school student could construct their own diversified portfolio during study hall. The stock market used to be a playground for the elite and the well-informed, and now it is overrun by Average Joes. This massive, recent influx of individual investors in the market appears to have had a substantial effect on the average P/E of the S&P 500.
When you lump the data sets all together, you come up with the following (rough) chart. (There are several years of missing data, so I could not perfectly create a chart. However, the trendline formed should be reasonably accurate enough for the purposes of this article.)
The Average P/E Ratio Before & After the Introduction of the Internet
We have all heard the statistic that the average P/E ratio of the S&P 500 is about 15. It has become a mantra – a sacred cow. When stocks are significantly below a P/E of 15, the broader markets are considered to be ‘undervalued.’ When over 15, they are considered to be ‘overvalued.’ …In fact, if you take the mean of all the P/E ratios since 1871 to today, you get the average P/E ratio of 15.55 – remarkably close to that sacred value of ’15’ – but what happens if you take the internet out of the equation?…
How does the average P/E of S&P 500 companies compare in the vast, mostly internet-free time period of 1871-1989 versus 1990-2015?
- During the 119 year time period of 1871-1989, the mean P/E of the S&P 500 was 13.72.
- During the 26 year time period of 1990-2015, the mean P/E of the S&P 500 was 23.91.
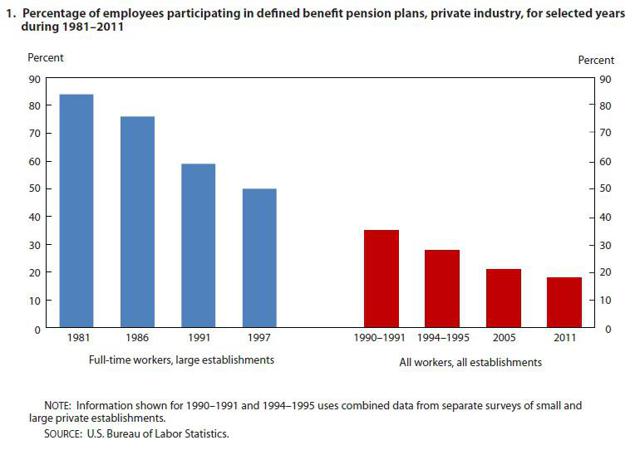
Participation In Defined Benefit vs. Defined Contribution Pension Plans Before & After the Introduction of the Internet
According to the Bureau of Labor Statistics, only 18% of private industry workers are covered by defined benefits plans, down from 35% in the early 1990’s.
Defined benefits plans like pensions have overwhelmingly been replaced by defined contribution plans like the 401(k).
From a 2015 study by the Bureau of Labor Statistics, 47% of employers offer defined contribution plans like 401(k)’s, while only 8% offer defined benefit (pension) plans.
This dramatic shift has forced many more people into managing their own retirement through the purchase of equities. The end result is far more retail investors flooding the stock market with funds. Whether this has been positive or negative for America is a topic for another discussion.
Drawing Conclusions
The internet today has made investing…[relatively easy] while the dominance of defined contribution retirement plans and the near disappearance of defined benefits plans has forced the retail investor into managing one’s own equities whether they like it or not. The end result is a massive influx of individuals actively investing in the stock market in a relatively short amount of time.
What used to be a stock market populated with mostly educated professional investor-types has been largely overrun by retail investors forced to invest in stocks whether they like it or not. In other words, the average investor is far more ignorant of market mechanics than ever before.
I think this is having a two-pronged effect:
- During bull markets, P/E ratios are being expanded more than ever before due to relatively ignorant retail investors unaware of how to accurately assess value to an equity piling on momentum.
- During market downturns, P/E ratios are crashing harder due to the same relatively ignorant retail investors exhibiting classic fear-driven, “buy-high-sell-low” herding mentality.
The end result, I believe, is that the historical average P/E ratio of ’15’ may no longer apply given the dramatic shift in market conditions.
Because there are so many more hands exchanging stocks, and the hands nowadays belong to retail investors without a clue of how the stock market functions, we can expect to see:
- higher P/E ratios moving forward when times are good, and
- harder crashes when the rug gets pulled out from underneath the market.
…Since good years overwhelmingly outnumber bad years, we may be seeing a new kind of technology-driven market where we can expect higher average P/E ratios moving forward. In other words, a P/E ratio of ’15’ may be a real bargain if ’20’ is the new fair market value.
*http://seekingalpha.com/article/3549536-the-historical-p-e-of-the-s-and-p-500-may-no-longer-apply?ifp=0
Related Articles from the munKNEE Vault
1. True or False: Earnings Drive Stock Prices
The belief that earnings drive stock prices powers the bulk of the research on Wall Street but this glaring exception to the idea of a causal relationship between corporate earnings and stock prices challenges that theory. Let me explain.
2. Average Joe Investors Underperform the Market – Here’s Why
Over the past 20 years, the S&P 500 has produced a 9.2% annualized total return. Over the same period, gold has returned an annualized 6.6%. And bonds? The Barclays U.S. Aggregate Bond Index has returned 5.7%. Based on these figures, what type of return do you think the average investor has achieved over this time period? The answer will shock you. Read on!
 munKNEE.com Your Key to Making Money
