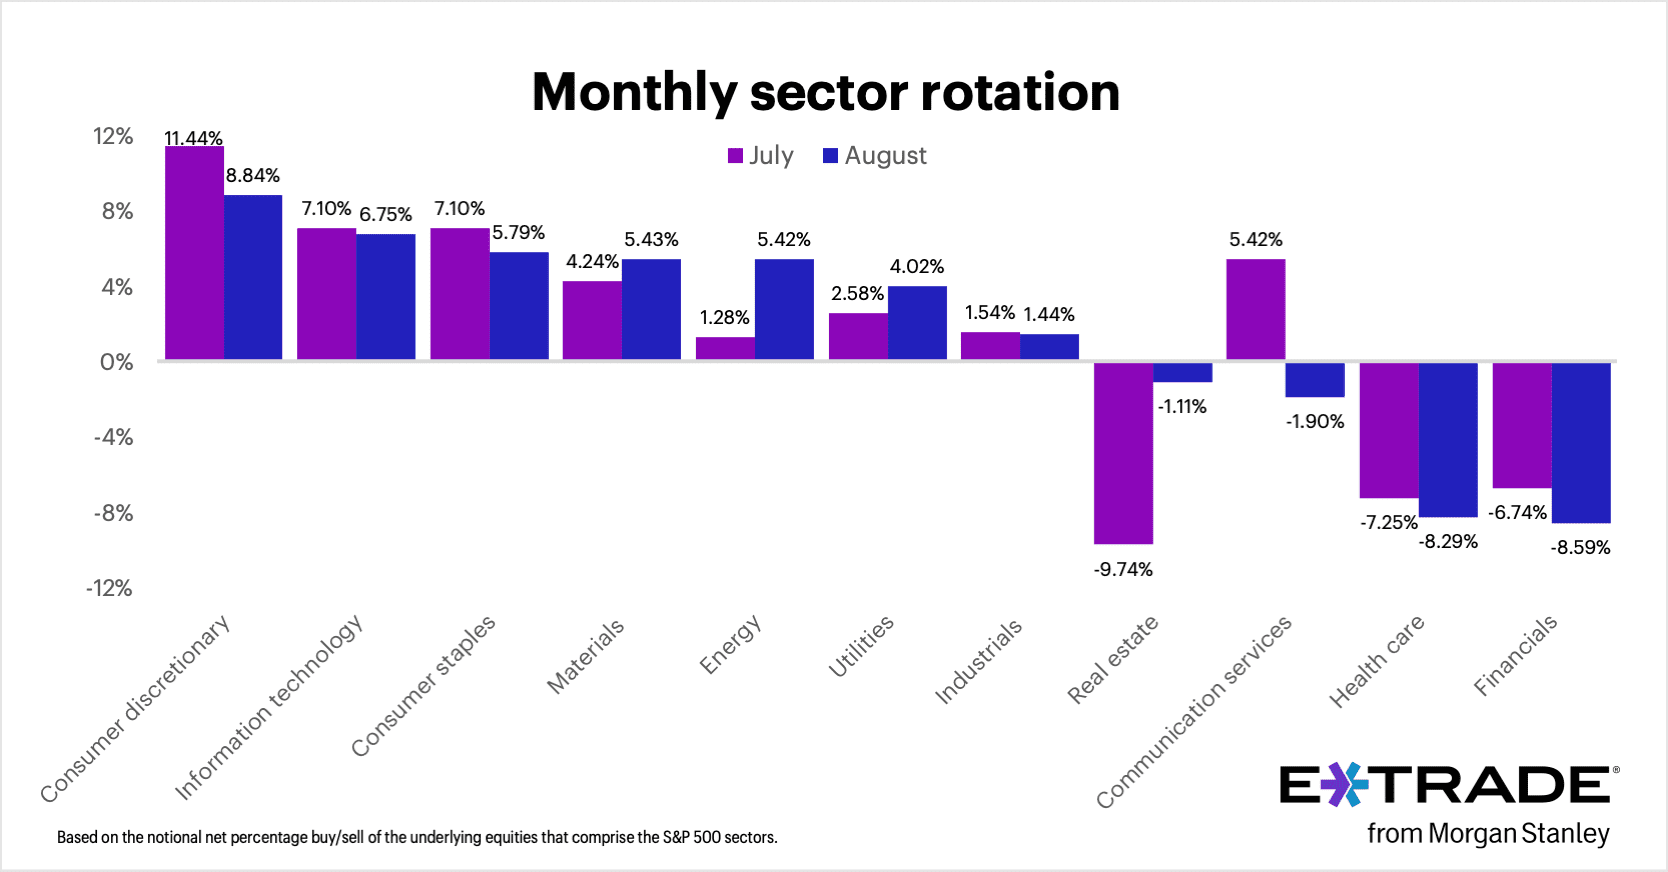
Last Tuesday, E*TRADE released its Monthly Sector Rotation data. The chart (see Figure 1) provides insights into how investors are moving in and out of different sectors within the S&P 500. It is based on the notional net percentage buy/sell behavior of E*TRADE customers. This data helps to understand trends and shifts in investor sentiment and sector performance over time.
According to E*TRADE, the top three sectors in August were Consumer Discretionary, Information Technology, and Consumer Staples, with money shifting out of Communication Services, Health Care, and Financials.
FIGURE 1: Monthly Sector Rotation

Consumer Discretionary, Information Technology, and Consumer Staples
Positive performance in the Consumer Discretionary sector in both July (+11.44%) and August (+8.84%) suggests that investors have been optimistic about this sector. This could be due to several factors, such as market sentiment and positive earnings reports from the summer season, which can see increased spending on travel, leisure, and other discretionary items.
With a lot of press about the sector rotation out of technology, IT was up 7.1% in July and up 6.75% in August to contradict this notion. However, in the S&P 500, the “Magnificent 7” stocks include companies from both the Information Technology, Communication Services, and Consumer Discretionary sectors. Here’s a quick breakdown:
- Information Technology (IT) Sector:
- Apple (AAPL)
- Microsoft (MSFT)
- NVIDIA (NVDA)
- Communication Services Sector:
- Alphabet (Google) (GOOGL)
- Meta Platforms (Facebook) (META)
- Consumer Discretionary Sector:
- Amazon (AMZN)
- Tesla (TSLA)
In addition, this change could also be explained by a rotation within each sector and out of the magnificent 7 stocks (Alphabet (Google), Amazon, Apple, Meta Platforms (Facebook), Microsoft, NVIDIA, and Tesla. These seven stocks are all down this month, anywhere from 5% to 15%, except for Tesla, which is up almost 2%.
Real Estate, Communication Services, Health Care, and Financials
The negative performance in the Real Estate sector, with a -9.74% decline in July and a -1.11% decline in August, indicates that investors were less optimistic about this sector with interest rate concerns and economic uncertainty weighing on these stocks.
In July 2024, there was a 14.1% drop in single-family housing starts, the lowest level since March 2023 and single-family building permits also fell in July by 0.1%. Key factors influencing the decline were higher house construction costs and higher mortgage rates. The August 2024 housing data should be released next week.
As previously mentioned, the decline in the Communication Services sections was attributed to the performance of major stocks within the sector, such as Alphabet and Meta, that witnessed selling in the month and a few key companies significantly influenced the sector’s overall performance.
Historically Ranking the Sectors
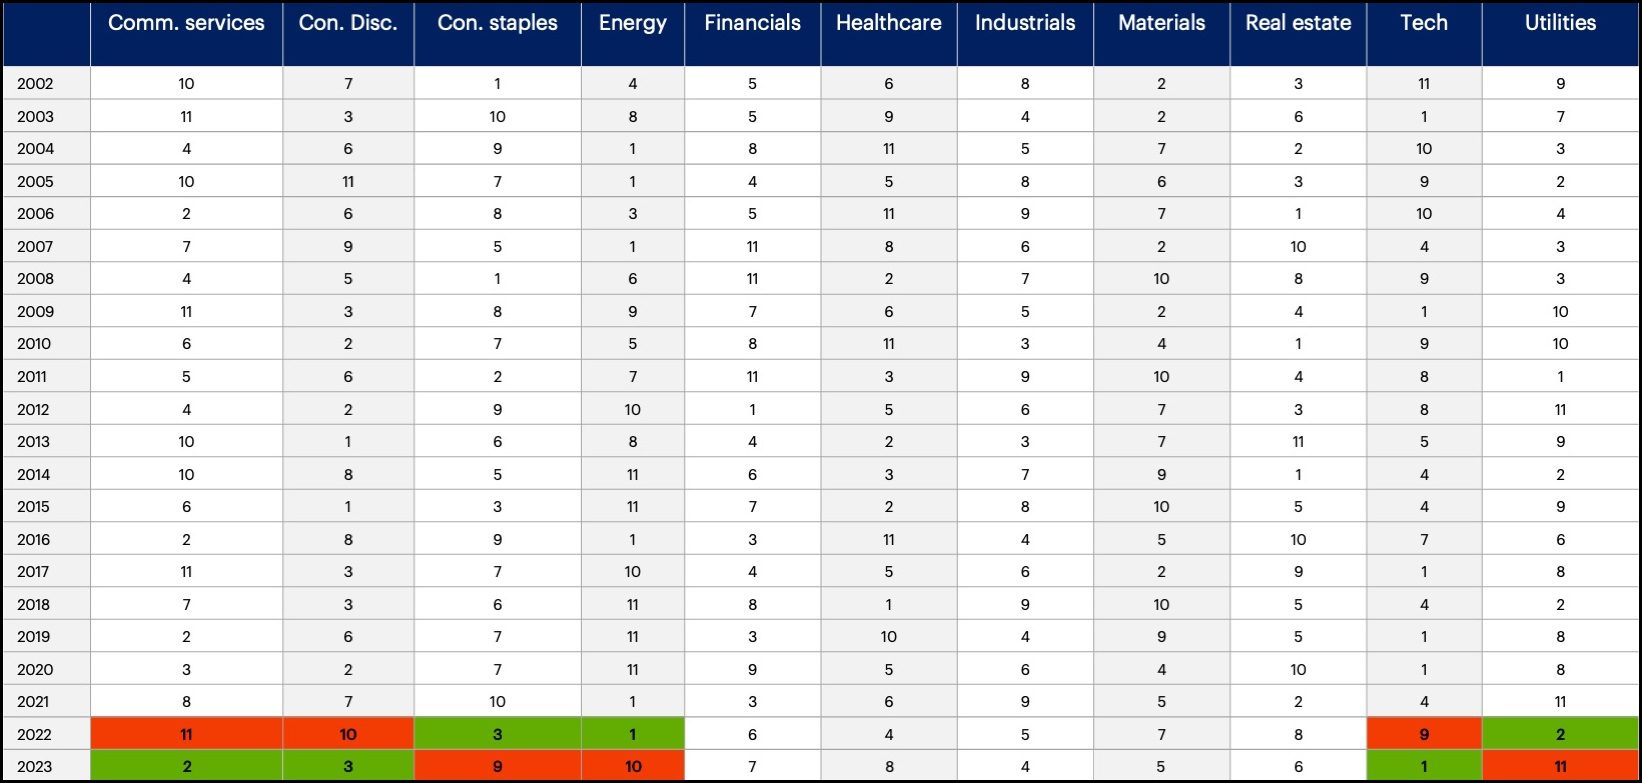
Looking at the E*TRADE’s S&P 500 Sector Ranking from 2002 to 2023 (see Figure 2), with 1 as the best performing and 11 as the weakest performing, a pattern observed over the past two decades is the “hot to not” trend, where at least one of the top-performing sectors in a given year tends to become one of the laggards the following year. This pattern held true in 2023, as the top sectors from 2022 (energy, utilities, and consumer staples) became the weakest performers, while the weakest sectors in 2022 (communications services, consumer discretionary, and technology) emerged as the strongest.
If this trend continues, sectors like technology, communications services, or consumer discretionary could underperform relative to others in 2024, though this may not necessarily result in negative returns.
Another consistent observation is that sectors leading one year rarely retain their top position the following year. Over the past two decades, the sector with the highest return in one year held the top spot the next year only three times.
More often, the leading sector finishes much lower in subsequent years. This raises questions about how technology, the top performer in 2023, may fare in 2024, as history suggests it could see diminished returns if this trend repeats.
FIGURE 2: Sector Ranking from 2002 to 2023 (1 = Strongest, 11 = Weakest)

 munKNEE.com Your Key to Making Money