Wind and solar generate over a tenth of the world’s electricity as illustrated in today’s infographic and, taken together, they are the fourth-largest source of electricity, behind coal, gas, and hydro.
This version of the original article by Bruno Venditti (visualcapitalist.com) has been edited [ ] and abridged (…) to provide you with a faster and easier read. Also note that this complete paragraph must be included in any re-posting to avoid copyright infringement.
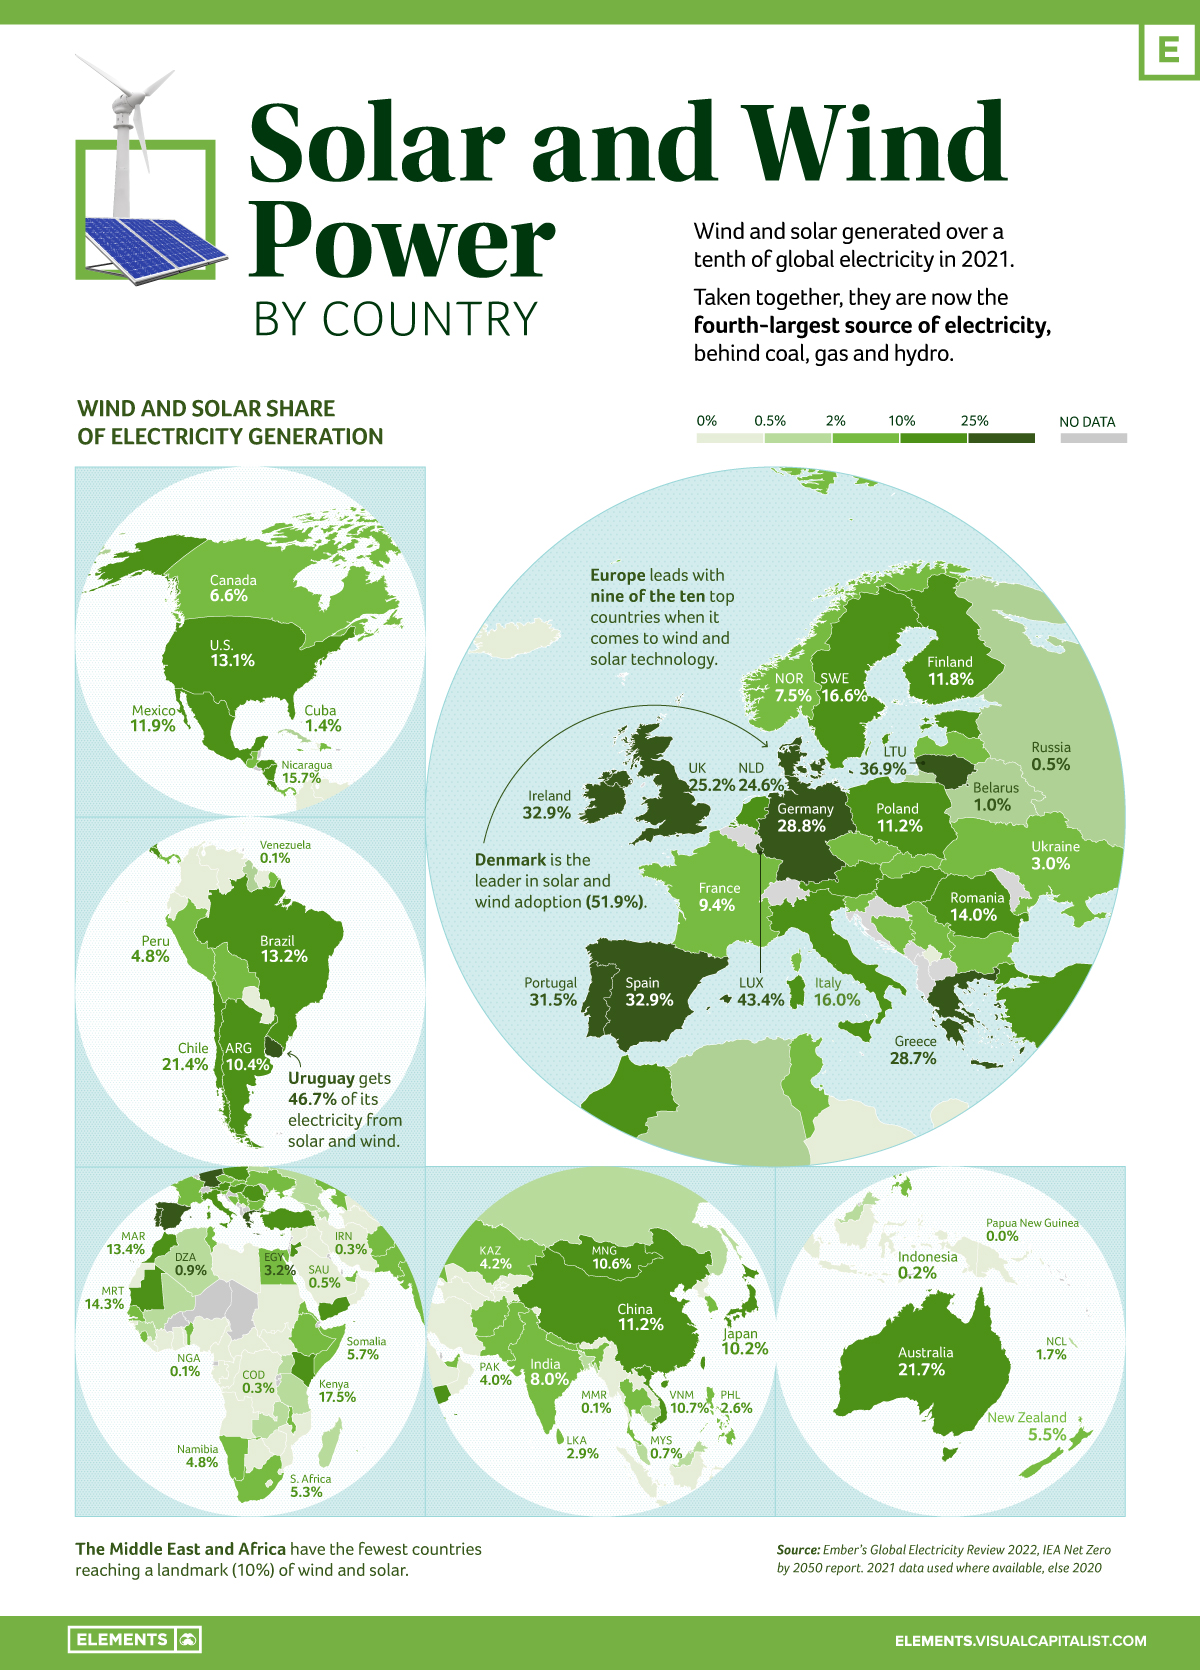
Despite the record rise in renewables in the last year (from 9.3% to 10.3%), however, current solar and wind electricity generation growth currently doesn’t meet the required marks to reach the Paris Agreement’s goals and need to grow at nearly a 20% clip each year to 2030 to hit that goal.
Related Articles From the munKNEE Vault:
1. China Is the #1 Generator Of Coal-fired Electricity; USA Is #3
In 2021, coal-fired electricity generation increased by 9% reaching all-time highs globally, showing that eliminating coal from the energy mix will not be a simple task despite 40 nations agreeing at the COP26 conference last year to phase coal out of their energy mixes. This infographic shows the aggressive phase-out of coal power that would be required in order to reach net zero goals by 2050.
2. Wind Power Generation By U.S. State – How Is Your State Doing?
Wind power is the most productive renewable energy source in the U.S., generating nearly half of America’s renewable energy and today’s infographic shows how much wind electricity different U.S. states generate, and breaks down wind’s share of total electricity generation in top wind power producing states.