Automatically receive the internet’s most informative articles bi-weekly via our free bi-weekly Market Intelligence Report newsletter (sample here). Register in the top right hand corner of this page.
Consumer debt – student loans, auto loans, and revolving credit such as credit cards and personal loans – but excluding housing-related debts such as mortgages and HELOCs – jumped…by 4.7% ($187B), to a record $4.2 trillion in the fourth quarter 2019. @A Financial Site For Sore Eyes & Inquisitive Minds
Without this $187 billion in additional spending funded by $187 billion in additional debt, the US economy would not have grown 2.3% in 2019, but only about 1.8%. This is why economists from the Fed on down want policies that encourage consumers to spend money they don’t have. It’s the American thing to do and, if there’s a hiccup down the road, so be it – and now there are some hiccups.@Your Finances
How heavy is the burden of this consumer debt on consumers?
- For a substantial part of Americans, there is no burden.
- They pay off their credit card balances every month,
- they have no student loans,
- and if they financed their vehicles it may be through leases that they took out not because that’s the only way they could buy the vehicle but because they saw various advantages in leasing.
- Then there is another group of Americans where every month is a mad scramble to make ends meet.
- Some earn good money but live above their means.
- Others are scraping by every month on low incomes.
- Both are up to their ears in debt. They’re one or two paychecks away from defaulting on that debt. That’s where the debt burden is, and that’s where the risks are.
In terms of overall consumer debt, this bifurcation gets averaged out. When measured against the size of the US economy, that $4.2 trillion in consumer debt amounts to 19.3% of nominal GDP, the highest ever in the data. Here are the last two decades:
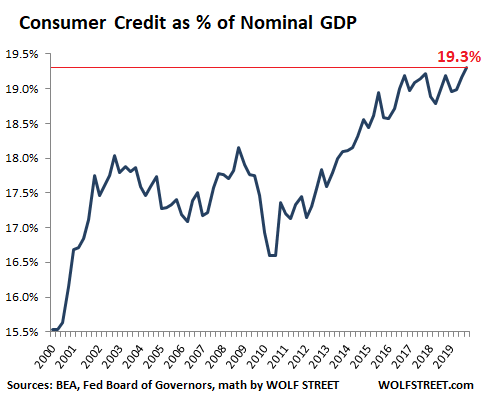
…Household mortgage debt, which is not included in consumer credit…is still a tad below where it had been at the peak in 2008, even though the population, the economy, the housing stock, and home prices have grown since then so, unless home prices crater again, Americans are in pretty good shape in terms of housing debt. The problem is in consumer credit and the big force behind the surge of consumer credit to 19.3% of GDP…[isn’t] credit cards, as we will see in a moment, but auto loans and particularly student loans. @Follow the munKNEE
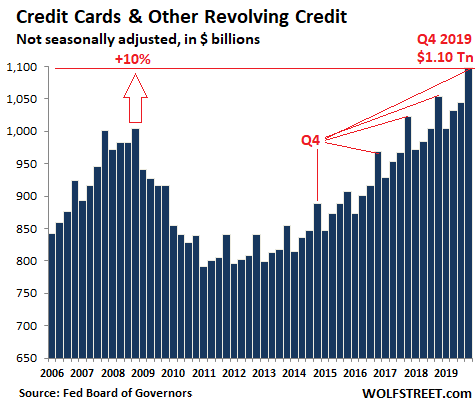
Credit Cards & Other Revolving Credit
Outstanding balances on credit cards and other revolving credit, rose 4.2% year-over-year in Q4…but, in overall terms, it amounted to only 5.4% of GDP, a big drop from peak-credit-card-craziness in Q4 2008, when it amounted to 6.9% of GDP so, when it comes to credit cards, Americans have become more prudent, to the great anguish of our economists and the banks that charge between 8% and 30% interest on those loans. Note the seasonality, induced by holiday-shopping season in Q4 and hangover season in Q1:
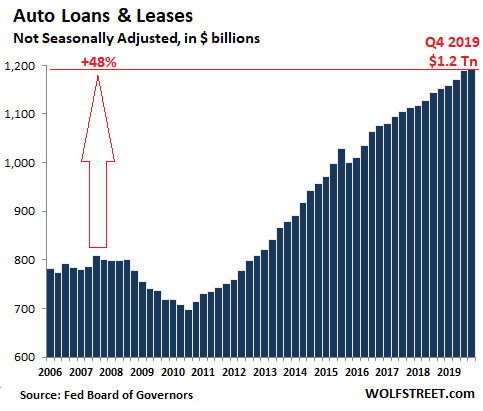
Auto Loans & Leases
Total auto loans and leases outstanding for new and used vehicles in Q4 rose 3.5% year-over-year, to a record of $1.193 trillion. Since the pre-crisis peak in 2008, auto loan balances have soared 48%. In terms of the size of the overall economy, auto-loan balances have ticked up from 5.3% of GDP in Q4 2008 to 5.5% of GDP currently. That was high back then, and it’s even higher now:
Not so ironically, the 3.5% year-over-year increase in auto loan balances occurred despite a 1.2% decline in new-vehicle unit sales as a result of:
- higher average transaction prices for new vehicles,
- rising loan-to-value ratios,
- and longer average duration of auto loans (therefore slower pay-downs).
This debt is getting more difficult to deal with for many consumers, and it’s making it impossible for many to trade and buy a new vehicle, and U.S. automakers and some imports have seen unit sales decline since their peak in 2015…
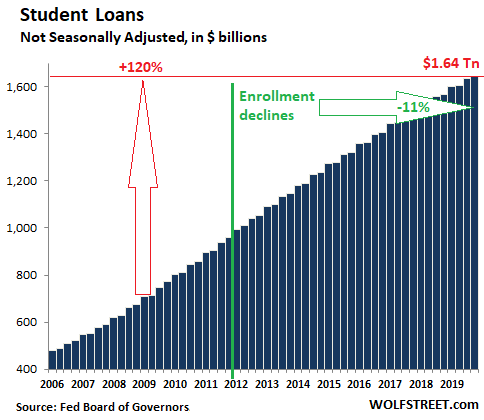
Student Loans
Student-loan balances rose by 4.7% in Q4 compared to a year earlier…[and] have soared 120% over the past decade. In terms of the size of the overall economy, student loans have soared from 4.6% of GDP in Q4 2008, to 7.6% of GDP now and this has occurred despite an 11% drop in student enrollment since 2011:
…According to a study by Moody’s, at the end of 2017,
- 50% of the 45 million federal student-loan borrowers owed less than $17,500 ($200B in total) which is very manageable debt…
- 7% of federal student loan borrowers owed over $100,000 each ($500B in total), and these were primarily borrowers with one or more graduate degrees.
The amount students spent on their education, in terms of the percent of median household income, had soared in the years through 2012 but then hit a ceiling and has since remained roughly flat with median household income, according to Moody’s study so why did loan balances soar like they did since 2012? Repayments have come to a trickle, with many students not even paying enough to cover interest expenses and their balance have actually risen.
Editor’s Note: The above excerpts from the original article by Wolf Richter have been edited ([ ]) and abridged (…) for the sake of clarity and brevity. The author’s views and conclusions are unaltered and no personal comments have been included to maintain the integrity of the original article. Furthermore, the views, conclusions and any recommendations offered in this article are not to be construed as an endorsement of such by the editor. Also note that this complete paragraph must be included in any re-posting to avoid copyright infringement.
Scroll to very bottom of page & add your comments on this article. We want to share what you have to say!