In the next 5 years most people will lose 75-90% of their wealth and  some 100% but investors needn’t lose most of their money if they took a few measures to protect their fortune…
The comments above and below are excerpts from an article by Egon von Greyerz (GoldSwitzerland.com) which may have been enhanced – edited ([ ]) and abridged (…) – by munKNEE.com (Your Key to Making Money!)
to provide you with a faster & easier read.
Register to receive our bi-weekly Market Intelligence Report newsletter (see sample here , sign up in top right hand corner). It’s free, so what the hell, sign up for it, try it out and if you don’t like it, unsubscribe. It’s that easy.
Growth in stock prices = Growth in debt
Stocks have been a massive beneficiary of the biggest monetary expansion that the world has ever experienced. If we look at the Dow since the last major economic cycle started in the early 1980s, we find a most remarkable rise – in early 1980 the Dow was at 850 and today we are 19,000 – of 9% per year on average since 1981…On top of that there has been a dividend yield of around 2% on average.
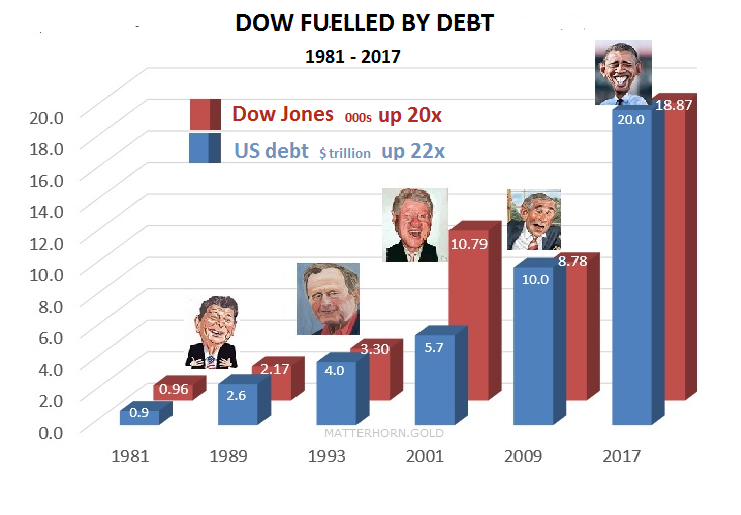
…Stocks don’t grow at 9% annually for 36 years without some rocket fuel and the explanation is very simple. Debt has provided the fuel because US debt has also grown by 9% annually since 1981 so the recipe for becoming a successful and loved president is just to print and borrow money.
There is an absolute correlation between the increase in US debt and the growth in the stock market.
- Reagan knew the secret. During his reign, he trebled debt from $900 billion to $2.6 trillion, leading to the Dow more than doubling from 960 to 2,200…
- Clinton didn’t have to print as much money to get the market up but
- Bush Jr had to almost double debt and still the market ended lower than when he took over eight years earlier.
- Obama doubled both debt and the Dow in line with the longer trend.
- The problem for Trump is that we are now at the point of diminishing returns and this started with George W already. When Bush Jr took over the Dow was 10,800 and now it is 18,800, a 74% increase, but to achieve that 74% rise in the Dow, debt went up by 250%. This means that Trump will have to print an awful lot of money to keep the stock market going up. Bearing in mind that the Dow is at record levels with p/e at over 20 and corporate profits falling, this is going to be virtually impossible to achieve. The chances for Trump to be re-elected after four years are very slim due to the present high level of the stock market together with record debt. Much better to became president with a weak economy and weak market like Reagan did.
[Before reading further check out this site]
In 1929 the Dow peaked at 400 and then collapsed to 40 in 1932. This 90% fall occurred at a point when economic conditions in the U.S. and globally were a lot more benign then they are today.
Since 1981 the Dow has gone up 22x. With the world experiencing a historical asset and credit bubble of unprecedented proportions, an implosion of debt could easily see the Dow down 90% like in 1929-32 or probably even 95% to get back to the 850 level where this bull market started. This would mean a fall of 95% in real terms. I say real terms because it is not unlikely that we will see the biggest money printing experiment in history with central banks worldwide printing trillions or even quadrillions of dollars in a futile attempt to save the financial system and the world economy. This massive money printing could lead to the Dow reaching much higher levels in nominal or hyperinflationary terms.
The Dow to fall 90% in real terms
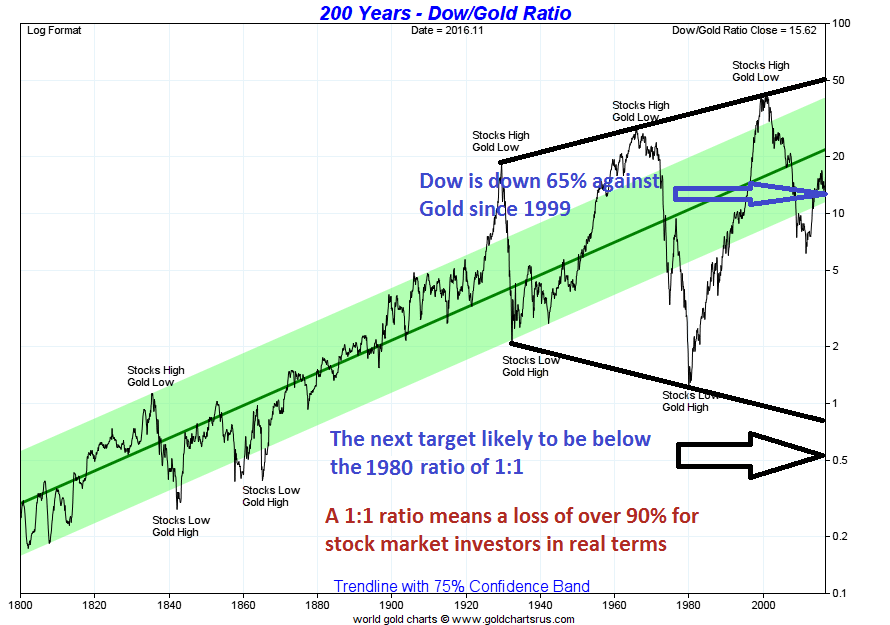
The best way to measure the Dow in real terms is against gold. Gold is the only money which has survived in the last 5,000 years and gold represents stable purchasing power. Over time gold doesn’t go up. Instead it is paper or fiat money that goes down until it reaches zero.
The Dow/Gold ratio peaked in 1999 and is now in a downtrend. Once the current correction is finished the ratio will continue down towards the 1:1 level like in 1980 when the Dow was 850 and Gold was $850. The only question is at what level the Dow and gold will be when they reach the 1:1 ratio. Will it be Dow 10,000 and Gold $10,000 – or will we see hyperinflationary levels of 100,000 Dow and $100,000 gold? The absolute level is really irrelevant because at whatever level they meet will involve a catastrophic loss of real capital for a stock market investor.
When the ratio reaches 1:1 this means a loss of more than 90% in real terms for stock market investors – $ 1 million in stocks would be worth less than $100,000 in today’s money – and remember that the last time a 90% fall happened in the Dow in 1929-32, it took 25 years to get back to the previous peak.
Property market will lose more than 75%
Finally, the property market has also been fuelled by the credit explosion. I meet many wealthy investors who believe that property is the best form of wealth preservation. It is of course true that property has been a fantastic investment for the last 100 years. For hundreds of years before 1913, inflation remained stable at 1-2% per year. It was the same with property values. A house in the early 1700s did not move much in price for 200 years until the early 1900s.
The creation of the Fed lead to credit growth and money printing of exponential proportions in most of the Western world and this is why property prices have moved up 1,000s of percent in the last 100 years. To believe that property now represent real value after the biggest rise in history, however, is very dangerous. In the last few years this bubble has additionally been fuelled by virtually free money with interest rates at zero or even negative.
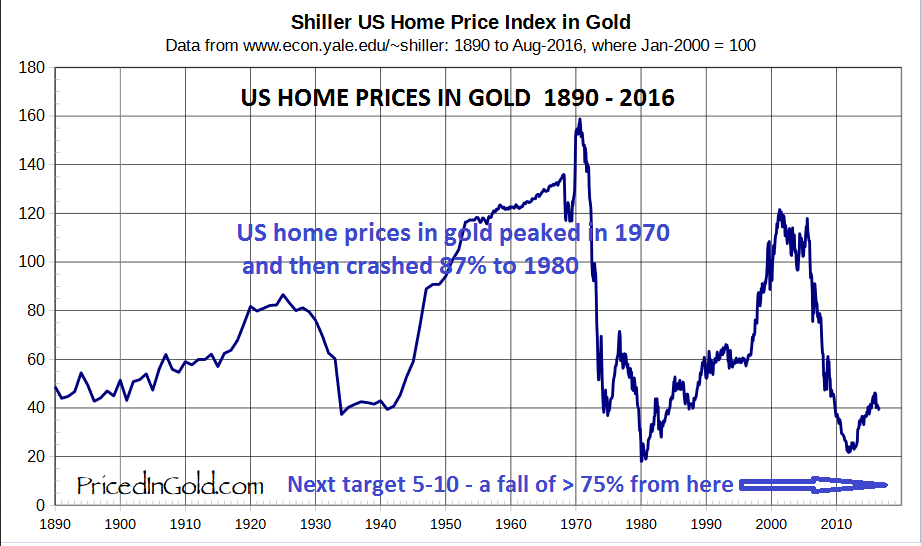
In gold terms US homes peaked in the early 1970s. The fall of an average US home against gold has been 87% since then. It could seem that US housing will not fall much further from these levels but when we look at the high level of lending in this market combined with low interest rates, it is likely that housing in the Western world will decline substantially from here. A minimum target is the 1980 level which would involve a 50% fall in real terms which is against gold but, bearing in mind the bubble nature of this market, it is more likely that we will see a 75-90% fall from here which means down to at least 10 on the index in the chart below.
The fall in asset prices and the consequent increase in the value of gold could happen in the next five years. If that will be the case, investors in stocks and property will lose 75-95% of their assets in real terms. This should not be seen as sensational levels but only a healthy correction after the biggest asset and debt bubbles in history. Yes, it will involve misery and a major adjustment for most people, but this is a necessary adaptation for the world to start growing again without excessive debt because, with debts of $250 trillion and derivatives in the quadrillions, there is no chance for the world economy to advance. All this debt must implode together with the assets that it has backed.
Gold best protection
Gold will clearly offer protection against the coming wealth destruction but it must be physical, held outside the financial system and outside the country of residence of the investor. Gold must also be kept in a politically safe country with a gold ethos.
The current correction in the gold price should be totally ignored. It is due to manipulation and a dollar which is temporarily strong. It is critical to be covered against the risks that I have outlined above and gold is the most important protection that anyone can own. People who don’t own gold are exposed to monumental financial and human risks.
What do you think about the above article? Have your say in the Comment Section below.
- “Like” this article on Facebook
- Have your say on Twitter
- Register to receive our free tri-weekly Market Intelligence Report newsletter (see sample here , sign up in top right hand corner).
- Every day, 7 days a week, I scan hundreds of financial articles, identify the best, and then repost abbreviated versions of them on munKNEE.com.
- I have been doing so for 9 years now and have posted 4,500 articles to date (see archives on Gold & Silver, Investing, Economic & Financial matters and some interesting Miscellaneous articles.)
- The newsletter is free so, what the hell, sign up for it in top right hand corner, try it out and if you don’t like it, unsubscribe. It’s that easy.
 munKNEE.com Your Key to Making Money


