Is the market overly complacent? Overly optimistic? Absurdly cheap or expensive? A great buy on dips? “No” is the best answer to all these questions, in my view. Now is not a time to take on oversized risks, but neither is it a time to cash in all your chips. Let me explain with the help of the 12 charts below.
 This article is an edited ([ ]) and revised (…) version of the original (written by Scott Grannis) to ensure a faster & easier read. It may be re-posted as long as it includes a hyperlink back to this revised version to avoid copyright infringement.
- North Korea remains the biggest threat to world peace, but markets remain nonplussed.
- Gold prices have inched higher, but are nowhere near levels that would suggest panic buying.
- The dollar has declined about 10% so far this year, but it is still trading above its long-term, inflation-adjusted average value relative to other currencies.
- Stocks show no sign of any significant correction despite trading near record highs.
- Sovereign yields are uniformly low, but still comfortably above their all-time lows of mid-2016.
The above being said, now is not a time to take on oversized risks, but neither is it a time to cash in all your chips as I explain below with the help of these 12 charts.
Chart #1: Gold vs. TIPS
I’ve been fascinated by the chart below for years. Why is it that the prices of two unique assets—gold and 5-yr TIPS—have been tracking each other for the past decade? The best answer I’ve come up with is that both are havens of a sort—safe ports in a storm. TIPS protect you against inflation and default, gold protects you from systemic collapse.
At current levels both gold and TIPS tell us that, although conditions today are somewhat better than they were 5 years ago, investors are nevertheless still paying a premium for safety. The long-term average, inflation-adjusted price of gold is somewhere in the range of $500-600/oz., by my calculations; and in normal times the real yield on TIPS would be expected to trade around 1% to maybe 2%. Both are priced to a premium these days, which suggests risk-aversion is still alive and well in today’s market.

Chart #2: Real Yields vs. Real GDP Growth
The chart below shows that the real yield on TIPS tends to track the trend growth rate of the economy. With a real rate today of zero, the TIPS market seems to be expecting real growth of the U.S. economy to continue to average about 2% per year, which is what we’ve seen for the past 8 years.
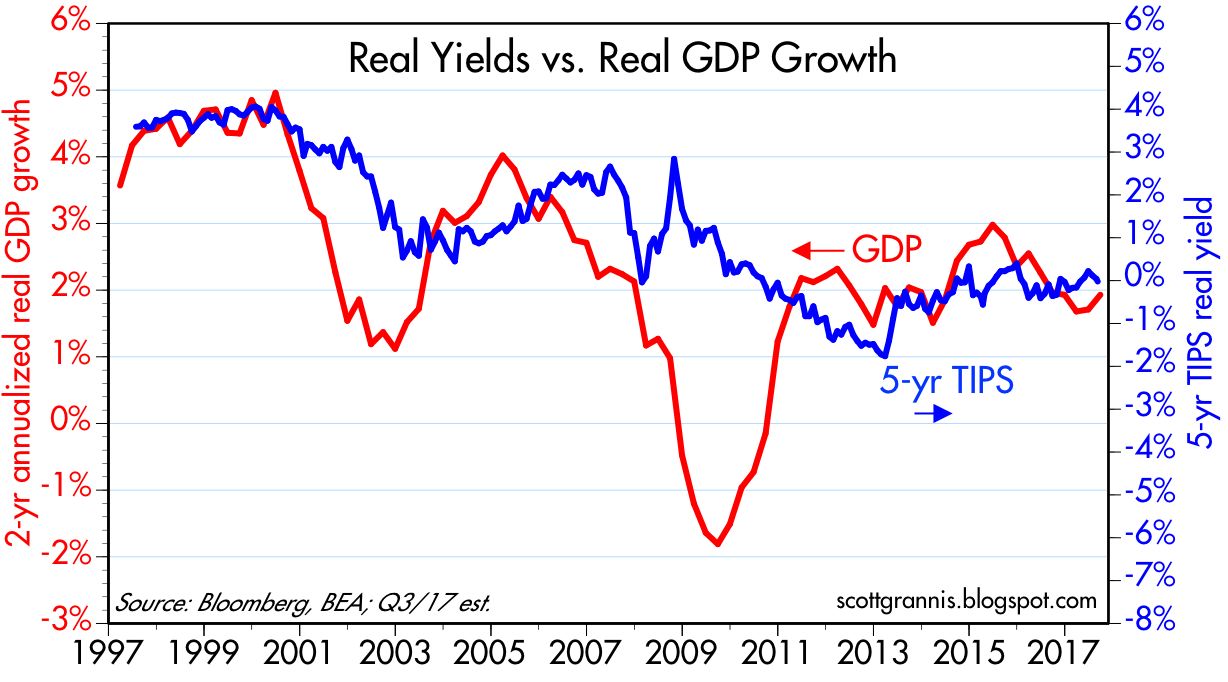
Chart #3: Real Trade-Weighted Dollar
The value of the dollar vis a vis other currencies rose following the November elections, but it has fallen by about 10% so far this year. As the chart below shows, the dollar is still above its long-term, inflation-adjusted average against two baskets of currencies. No big message here, but it seems to rule out excessive optimism and excessive pessimism.

Chart #4: Wall of Worry
The chart below shows how the market has reacted to major events in recent years. The recent reaction to the heating up of North Korean risk is rather tepid, and significantly less than other episodes of panic attacks.

Chart #5: ISM Manufacturing vs. GDP
Last week’s release of the ISM manufacturing indices for August was very encouraging. The chart below suggests that the new-found strength of the manufacturing sector points to overall economic growth of at least 3-4% in the current quarter. The Atlanta Fed’s GDP Now forecast for this quarter currently stands at 3.2%, a bit better than the second quarter’s 3.0%.
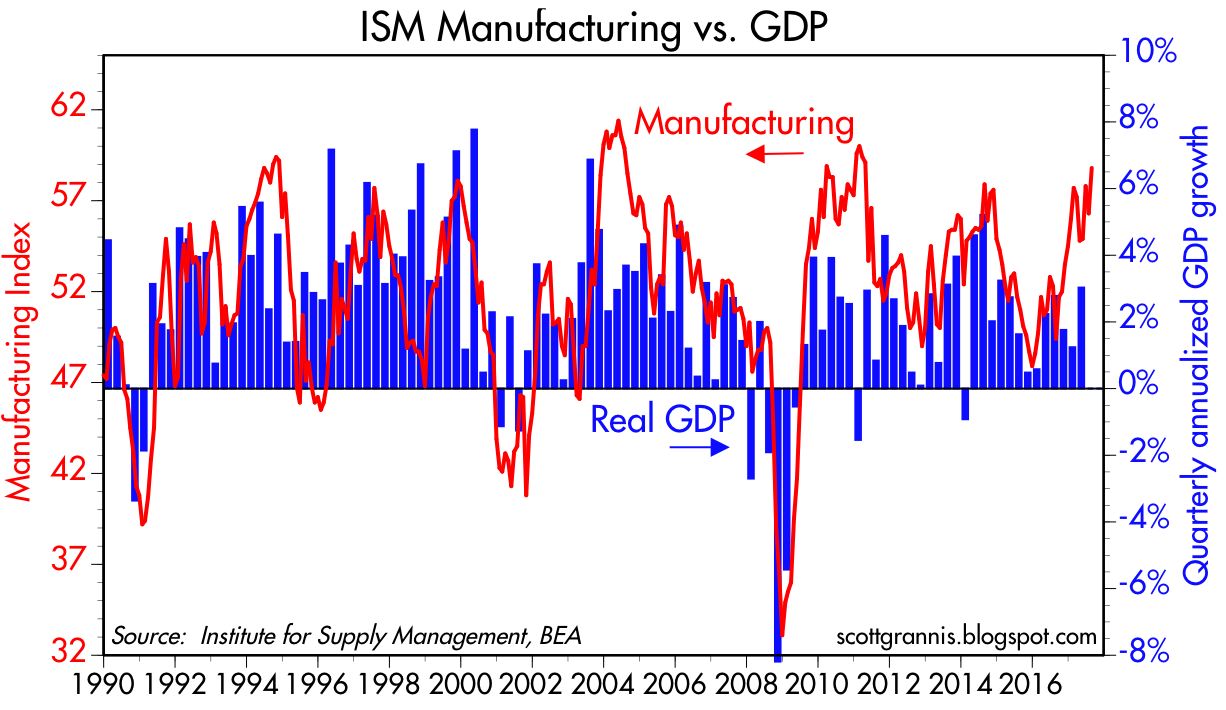
Chart #6: ISM Manufacturing Employment Index
The manufacturing employment index (see below) was very strong, suggesting that manufacturers see improving conditions and thus plan to ramp up their hiring plans.

Chart #7: Manufacturing Indices – U.S. vs. Eurozone
The upturn in US manufacturing mirrors a similar improvement in the Eurozone. Synchronized recoveries are always welcome!

Chart #8: ISM Manufacturing vs. S&P 500 Revenues per Share
Based on past correlations, the strength of the ISM manufacturing index says that revenues per share of major US corporations are likely to remain strong for the foreseeable future. Coupled with near-record profits, this provides a reasonable basis for a continuing rally in equity prices.
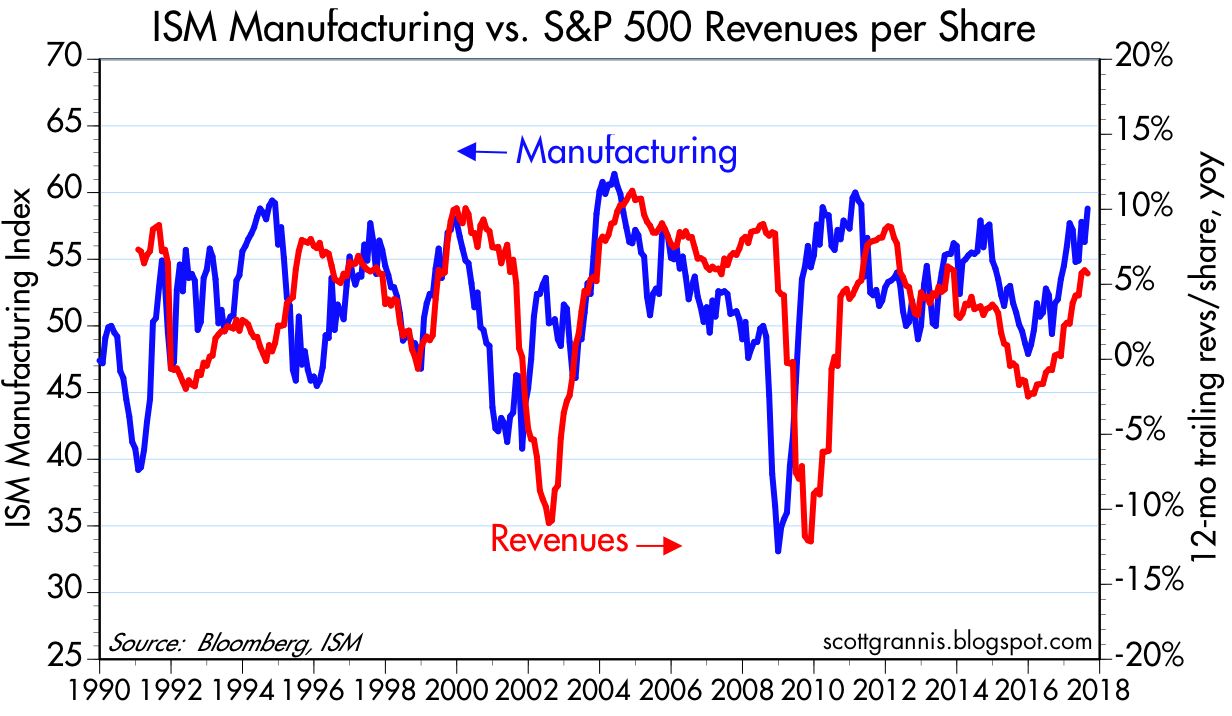
Chart #9: Light Vehicle Sales
Not all industries are looking up, however.
- The August report on car sales was decidedly weak, as the chart below shows.
- Construction activity has softened in recent months,
- and bank loans to small & medium-sized businesses have been flat for over six months.
There are pockets of strength and weakness, and that probably means no boom and no bust, as I noted last month.
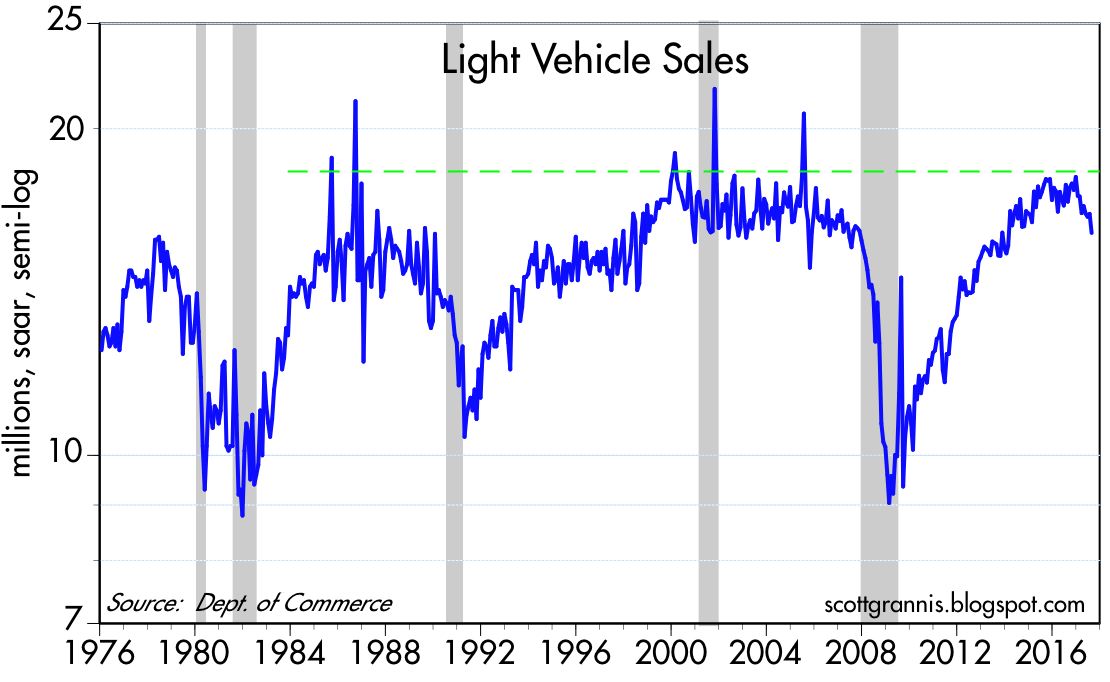
Chart #10: Brazilian Stock Market
…Measured in dollars, the Brazilian stock market has climbed 150% in the past 20 months. It’s still far below its previous highs, however…but the outlook has changed from dire to somewhat promising. This is one of those cases where the market was expecting a disaster which has failed to materialize…

…Emerging markets are riding the crest of two powerful waves:
- a weaker dollar
- and rising commodity prices.
Chart #11: CRB Index
Industrial metals prices are up 66% in the past 18 months. This strongly suggests that global economic activity is picking up.

Chart #12: U.S. Dollar vs. CRB Metals Index
The fact that the USD is now weakening as commodity prices rise (which is their natural tendency) suggests that the rise in commodity prices may reflect a weakening in the demand for dollars at a time when their supply is abundant, and that is a classic recipe for rising inflation.

It’s premature to make a big rising inflation call, however, since the bond market continues to expect inflation to be relatively low, in the range of 1.5-2.0% for the foreseeable future. As I mentioned last week, this is something to worry about, not a reason to panic.
Related Article from the munKNEE Vault:
1. Credit Crisis? What Credit Crisis?
The charts in this post focus on the absence of evidence of a looming credit crisis.
munKNEE should be in everybody’s inbox and MONEY in everybody’s wallet!
If you want more articles like the one above sign up in the top right hand corner of this page and receive our FREE bi-weekly newsletter (see sample here).
munKNEE.com – ” The internet’s most unique site for financial articles! Here’s why“