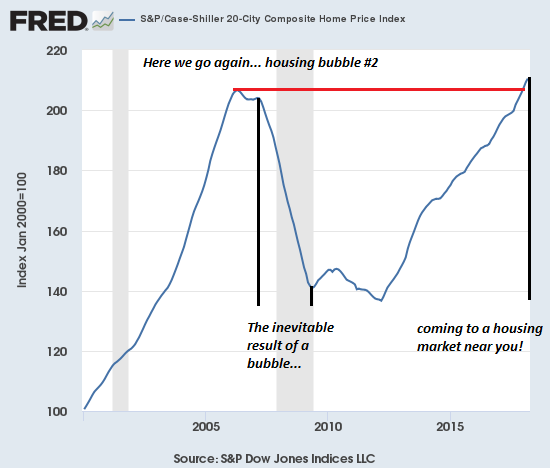
Well, folks, here we go again: we have a double-bubble economy in housing and stocks, and a third difficult-to-chart bubble in greed, euphoria and credulity.
The original article has been edited here for length (…) and clarity ([ ]). For the latest – and most informative – financial articles sign up (in the top right corner) for your FREE tri-weekly Market Intelligence Report newsletter (see sample here)
Feast your eyes on Housing Bubble #2, a.k.a. the Echo Bubble:
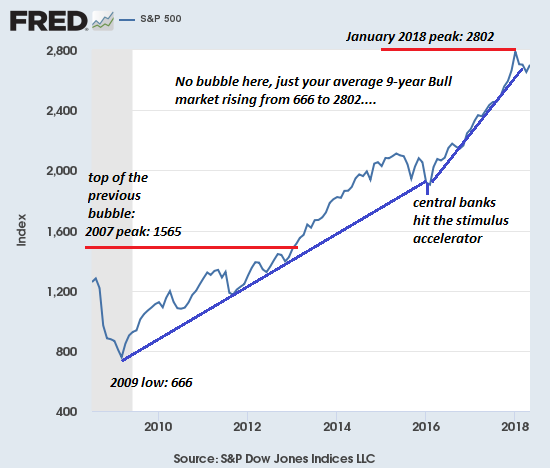
Here’s the S&P 500 stock index (SPX): no bubble here, we’re told, just a typical 9-year long Bull Market that has soared from a low in 2009 of 666 to a recent high of 2802 in January of this year:
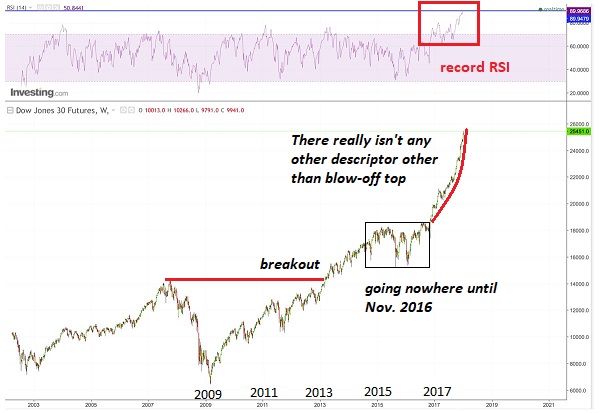
Here’s a view of the same bubble in the Dow Jones Industrial Average (DJIA):
Is anyone actually dumb enough not to recognize these are bubbles? Of course not. Those proclaiming that “these bubbles are not bubbles” know full well they’re bubbles, but their livelihoods depend on public denial of this reality and so we’re inundated with justifications of bubble valuations, neatly bound with statistical mumbo-jumbo: forward earnings (better every day in every way!), P-E expansion, and all the rest of the usual blather that’s spewed by status quo commentators and fund managers at the top of every bubble.
The problem with bubbles:
- They always pop. The market runs out of Greater Fools and/or creditworthy borrowers, and so sellers overwhelm the thinning ranks of buyers. Those dancing euphorically, expecting the music will never stop, are caught off guard (despite their confidence that they are far too clever to be caught by surprise), and the panic-driven crowd clogs the narrow exit, leaving a ballroom of bag-holders to absorb the losses.
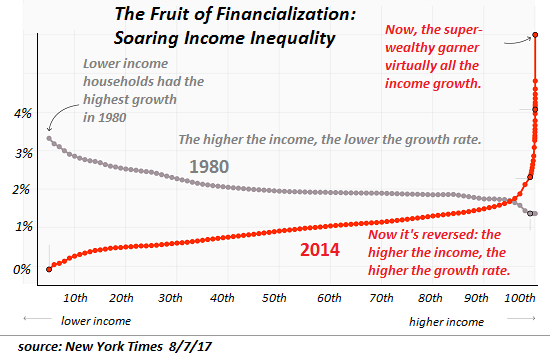
- We’ve become dependent on them as props holding up a rotten, corrupt status quo. Since the economy can no longer generate sufficient prosperity to go around via actual increases in productivity and efficiency, those skimming most of the gains rely on “the wealth effect” generated by expanding asset bubbles to create a dreamy illusion of prosperity.
- The gains flow to the very top of the wealth-power pyramid: there is no other possible output of the bubble, since roughly 80% of all assets are owned by the top tier of households, and the majority of financial assets are owned by the top .1% (one-tenth of one percent).
Since only owners of assets reap gains from asset bubbles, only those who own assets benefit. That leaves out the bottom 90%, and if we’re honest with ourselves (now verboten), the bottom 99.9%, despite the heady illusion at the apex of the bubble (i.e. the present housing and stock markets).
The bubbles in assets are supported by the invisible bubble in greed, euphoria and credulity. We believe what we believe will make us rich, what feeds our euphoric confidence that the bubble-music will never stop and our credulity that bubbles which we know will pop will not pop until we’ve safely cashed out.