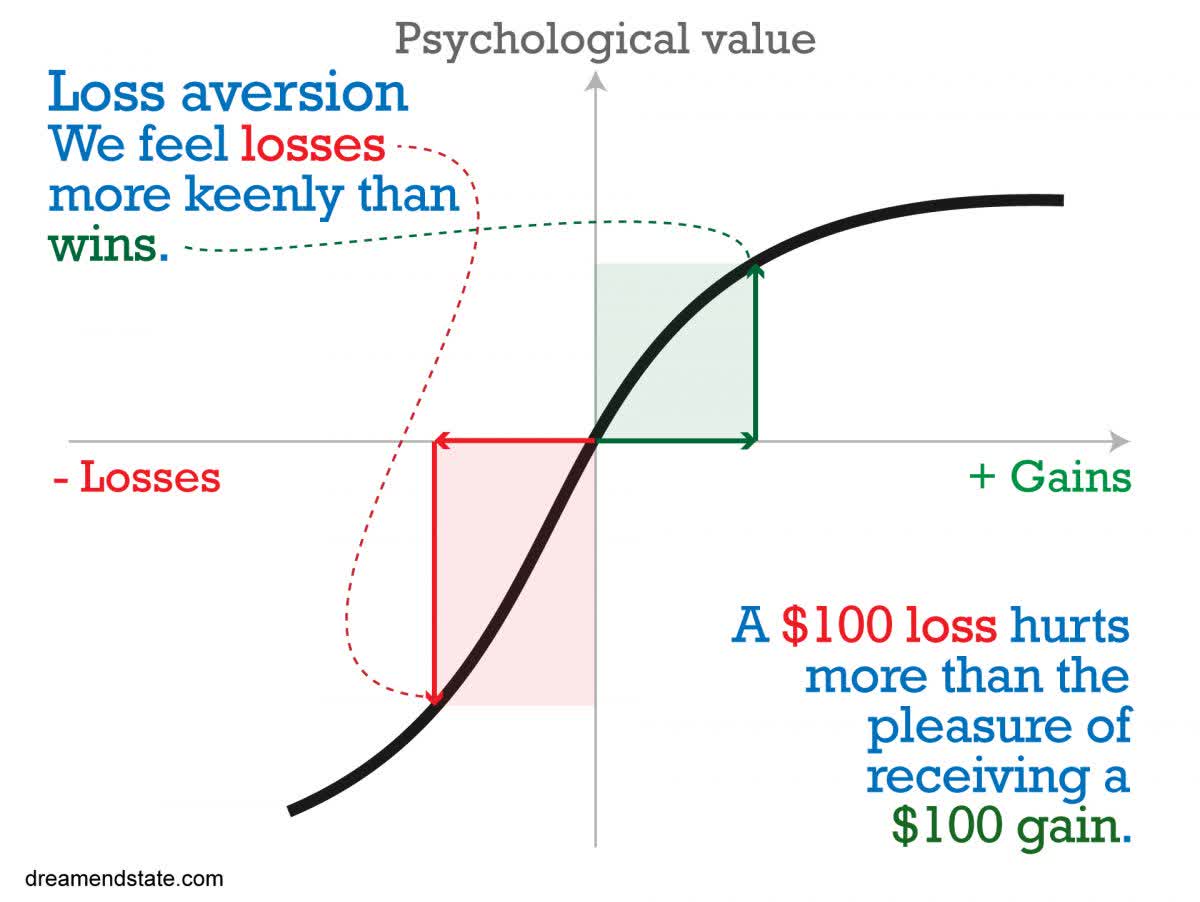
Human beings experience losses twice as keenly as they do gains so when a sell-off of any magnitude occurs in the stock market…loss aversion reigns…What action(s} investors should take…[depends on their assessment of whether] the ongoing sell-off is indicative of just a correction…[or] of a recession?…This article provides commonly used definitions, key distinctions, useful metrics for assessing the prevailing probability of each.
Definitions: Corrections vs. Recessions
Investopedia defines
- corrections as “a decline of 10% or more in the price of a security from its most recent peak…”
- According to CNBC analysis of 26 market corrections since World War II, the average decline is of ~13.7% and the recovery in price to prior levels usually takes 4 months on average...
- Recessions, in turn, are defined as “two or more consecutive quarters of decline in real GDP.”
- [Keep in mind that] recessions (bear markets) in the stock market can occur without recessions in the underlying economy. Furthermore, a recession can result in stock market losses, from peak to through, of as little as 20% (1990) to as great as 56% (2007).
It is often not the magnitude of the loss itself but the length of the bear market and of the expected recovery in itself that poses the most troublesome concerns. The length of the bear market (which stocks undergo as a result of a recession) can be as short as 1 to 3 months (1990, 2020) or as long as 21 to 31 months (1973, 1980, and 2000)…
- A 30% drop in the stock market can be a wonderful opportunity for many, especially if the recovery only takes a year or less in time. Thus, being able to assess the probability of an ongoing sell-off being indicative of a correction versus a recession can be incredibly helpful and lucrative.
How To Increase One’s Likelihood Of Success
..[No] one can predict the future…[but] what we can do is use probabilistic decision making to increase our likelihood of success (making money) and decrease our changes of failure (losing money). In every-day life and in the business world, this is as simple as following 3 basic rules:
- Invest in yourself and in your education continuously and to the best of your ability plan and develop a career that caters to your strengths. Having a reliable job and steady cash flow is integral to financial independence.
- Live within your means. Do not spend money beyond the necessities of a comfortable life…Ideally, you’d want to save and to invest 60% to 80% of your income, if at all possible.
- Diversify your income streams, ideally to a source of passive cash-flows (dividends, rental income, scalable business model). This will allow you much greater freedom and time to pursue the things you love to do. When you do this, you’ll be happier. When you’re happier, you will naturally be predisposed to increased productivity, increased likelihood of success, and improved networking and relationship building with other people.
Helpful Metrics
Within the realm of investing, and in particular as it pertains to assessing whether the stock market drop is the onset of a correction versus a recession, there are at least a few highly helpful metrics to help investors directionally.
1. Investor Sentiment:
Contrarian investment usually implies using “herd mentality” to one’s advantage and thus buying when optimism (as measured by investor sentiment) is low and selling when optimism is high.
There are several publicly available sources of tracking investor sentiment, admittedly usually with a week’s delay.
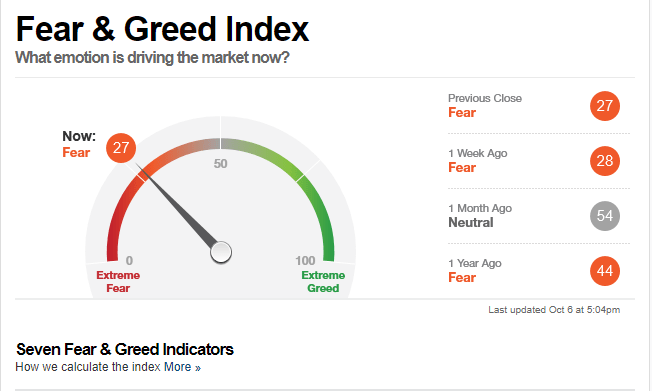
Source: CNN Business
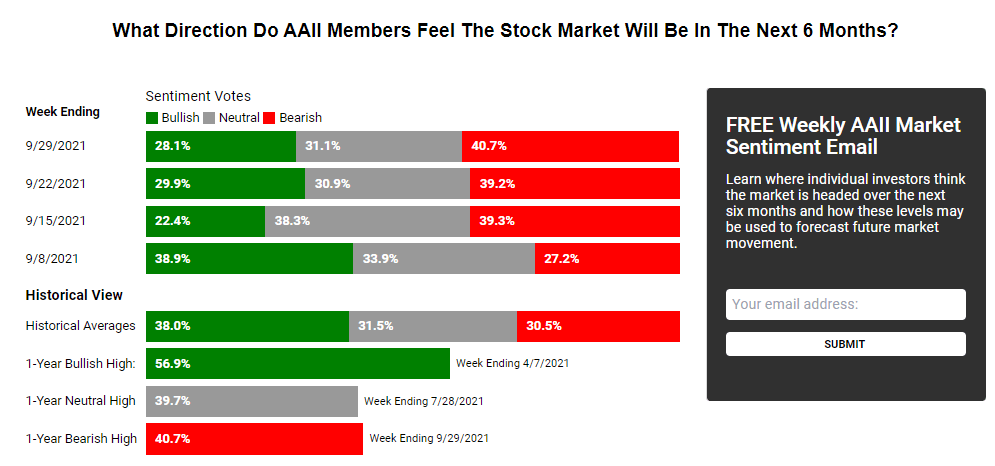
Source: AAII Investor Sentiment Survey
Globally, there are is also the UBS Investor Sentiment Survey, which usually occurs quarterly and thus is not as reliable for predictive purposes unless the timing perfectly aligns with when you’re performing your analysis…The useful nature of such surveys is two-fold:
- At the onset of a bear market or recession, euphoria may often persist or roll-over until more serious losses are experienced. In general, if you’re seeing continued high “greed” or “bullish” ratings while the stock market has dropped by ~5% or is still dropping, this is a sign of more pain to come. Keeping in mind that the surveys are delayed, one can still use them to assess the timing and duration of a stock market drop.
- Alternatively, if the surveys indicate “fear” or “bearish” ratings while the stock market is dropping, this can be incredibly soothing for contrarian investors. This indicates that investors were already risk-averse and wary even prior to the incipience of the stock market drops and thus further severe losses may be limited as fewer investors will be blindsided due to cognitive dissonance experienced when the reality and steepness of the drop and losses (as well as potential permanence of such losses) sinks in.
2. The GDP / GNP, ISM Manufacturing PMI, Inflation, and Unemployment
Surprisingly, one rarely hears discussion of GDP (GDP measures the value of goods and services produced within a country’s borders, by citizens and non-citizens alike) and/or GNP (GNP measures the value of goods and services produced by only a country’s citizens but both domestically and abroad) as of late, yet underlying economic metrics can be incredibly helpful for gauging if there’s a possibility or likelihood of another recession (as opposed to a more common ongoing stock market correction). Yes, the metrics lag the occurrence or onset of actual corrections and in particular, recessions.
- GDP: One can usually see weakness in GDP 1 to 2 quarters in advance, and certainly all can agree that the probability of a recession suddenly occurring is higher if the GDP growth for the prior to quarters is weak (1% to 3%) versus strong (above 3%). [Incidentally,] as of Q2 2021, real gross domestic product (GDP) increased by 6.7%, following a Q1 2021 increase of 6.3%.
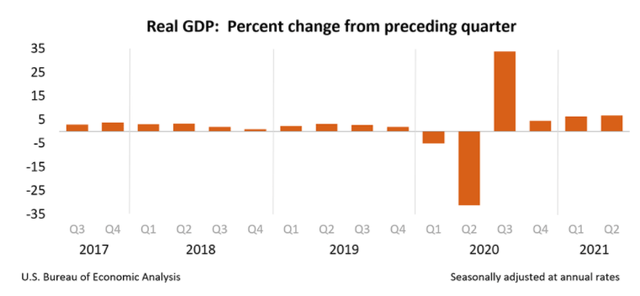 Source: U.S. Bureau of Economic Analysis (BEA)

- One can also assess the gross national product (GNP)…[but] GDP is the most commonly used by global economies.
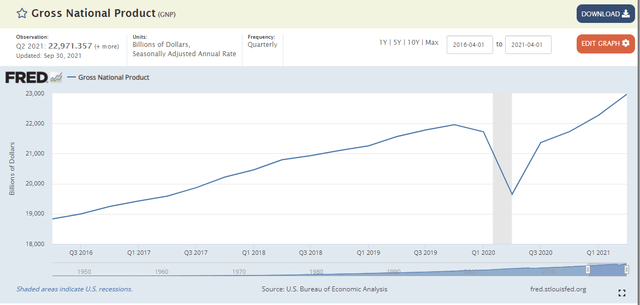 Source: St. Louis Fed

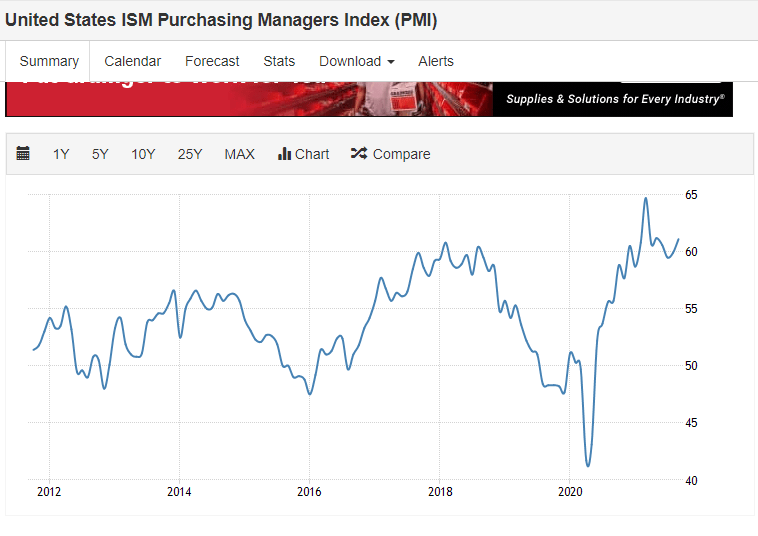
- The ISM Manufacturing PMI can also be useful for a directional assessment.
- A PMI above 50 represents expansion, and trends in the metric can be assessed to see if a recession may be imminent. Obviously, if the metric is trending upward (as opposed to downward sloping), the likelihood of a stock market sell-off being correlated to a recession, as opposed to a correction, is lessened.
- Inflation: As of September 2021, the 12-month inflation rate is 5.3%, and is expected to stay that high through the end of the year…[but] higher inflation, in [and] of itself, is not sufficient evidence in support of a recessionary environment, and there may very well be unique factors due to the COVID pandemic explaining the occurrence…
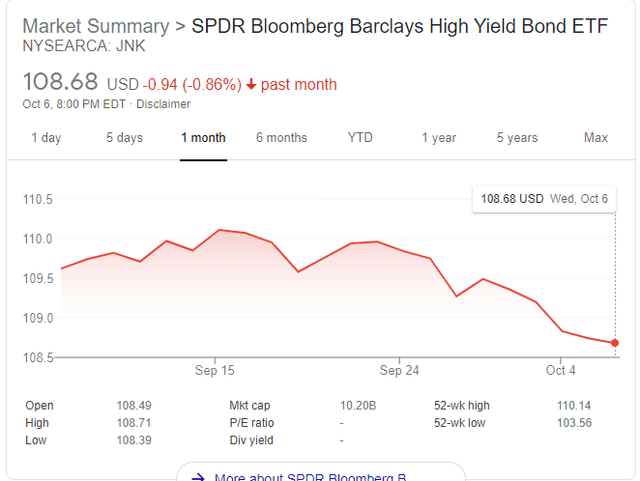
- One of the simplest indicators to watch for an indication of correction versus recession is the junk stock (JNK) index.
- The magnitude of the drop can readily tell you if you should be worried or not;
- drops of sudden and large magnitude (1% to 5% over only 5 to 10 trading sessions) are cause for alarm
- gradual drops of only up to 1% to 3% over 10 to 30 trading sessions are on-par with standard market dynamics, at least for the past decade.
- The magnitude of the drop can readily tell you if you should be worried or not;
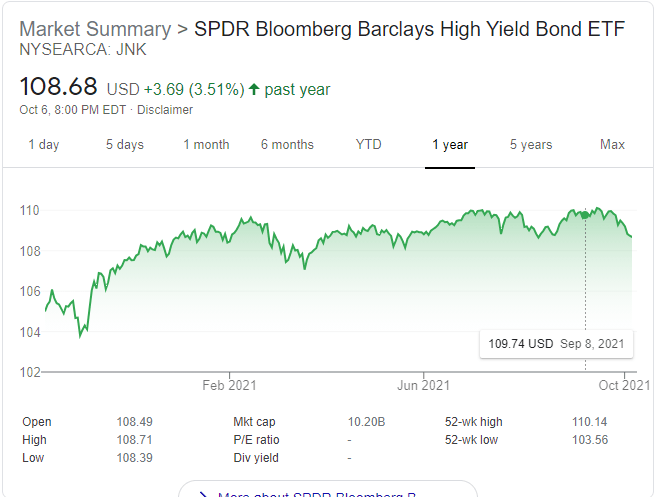
 Source: Google

Summary
…[From the above one can see that] using only a handful of macro-economic metrics – all publicly available – can readily steel your nerves and better prepare you in terms of determining probabilistically whether a recession is imminent or if the ongoing stock market sell-off is most likely a correction.
Suggested Action
Once a probabilistic determination is made by an investor regarding the prospects of a correction versus recession, investors can contemplate next steps:
- If a recession marked by deflation, sell most stock assets, bond assets and real estate assets as soon as you are confident it is a recessionary drop that will be marked by deflation and invest in…the USD or the Euro or other strong, reliable currencies).
- If a recession marked by stagflation, sell most stock assets, (bond assets are per your personal decision), and invest heavily in real products such as commodities and real estate (mostly, choose real estate in growing cities or neighborhoods).
- If a correction, wait for 6 to 10 weeks and begin dollar cost averaging into your favored high quality business(es)…By dollar cost averaging during corrections (as opposed to continued and sustained uptrends), an investor is taking advantage of temporary dips in the share price to acquire shares of high quality businesses at a discount of 5% to 15%.
For reference, go here for some outstanding high quality businesses, all with plentiful competitive advantages, that are worthy of consideration in the coming weeks, if not immediately.
Editor’s Note: The original post has been edited ([ ]) and abridged (…) above for the sake of clarity and brevity to ensure a fast and easy read. The author’s views and conclusions are unaltered and no personal comments have been included to maintain the integrity of the original article. Furthermore, the views, conclusions and any recommendations offered in this article are not to be construed as an endorsement of such by the editor. Also note that this complete paragraph must be included in any re-posting to avoid copyright infringement.
A Few Last Words:
- Click the “Like” button at the top of the page if you found this article a worthwhile read as this will help us build a bigger audience.
- Comment below if you want to share your opinion or perspective with other readers and possibly exchange views with them.
- Register to receive our free Market Intelligence Report newsletter (sample here) in the top right hand corner of this page.
- Join us on Facebook to be automatically advised of the latest articles posted and to comment on any of them.